

Unlocking Twitter Analytics: What Successful Users Know

Understanding your audience and your content’s performance is key to success on Twitter. Twitter Analytics provides the valuable insights you need to navigate the platform effectively. It offers more than just simple metrics; it gives you the information necessary to transform your Twitter strategy. This section explores how successful users utilize these insights to create engaging content and informed decisions.
Why Accessing Twitter Analytics Matters
Knowing how to access and interpret your Twitter analytics is fundamental. This free tool provides a deeper understanding of your tweets and overall profile performance. Accessing your analytics is simple. Log in to your Twitter account and go to analytics.twitter.com or select “Analytics” from the main menu on the web platform.
The dashboard presents key metrics such as tweet impressions, engagements (likes, retweets, replies), profile visits, mentions, and follower growth over time. This data provides a foundation for analyzing your Twitter performance and identifying areas for improvement. For a more in-depth understanding, explore additional resources like Backlinko’s guide on Twitter user statistics.
Key Metrics: Beyond the Surface
Effective analysis requires understanding which metrics truly matter. While follower count can be a tempting metric, focusing on engagement, impressions, and profile visits provides more actionable information. A high impression count with low engagement may suggest your content is visible but not resonating with your audience.
This signals a need to refine your messaging or try different content formats. Tracking profile visits shows how effectively your tweets drive traffic to your profile, which can lead to new followers. By understanding these key metrics, you can gain a more complete picture of your Twitter performance.
Data-Driven Decisions for Optimal Results
Successful Twitter users use data to inform their actions. Analyzing trends in engagement timing, content preferences, and interaction types reveals what resonates with your audience. If you see a consistent spike in engagement on certain days or times, adjusting your posting schedule to align with these peak periods can significantly boost visibility.
Remember, audience behavior is dynamic. Continuously monitoring your analytics and adapting your strategy is crucial for sustained growth. This iterative approach allows you to stay ahead of the curve and maximize your impact on Twitter.
Accessing Your Data: The Insider’s Path to Twitter Insights
Understanding your Twitter data is key to a successful strategy. This section outlines how to access those valuable insights, whether you’re on your desktop or mobile device. We’ll also explore how third-party tools can enhance your analytics experience.
Navigating Twitter Analytics on Desktop
Accessing your analytics on desktop is simple. After logging into your Twitter account, go directly to analytics.twitter.com. Alternatively, click “More” in the left-hand menu, select “Creator Studio,” and then choose “Analytics.” This takes you to your main analytics dashboard.
This dashboard provides a comprehensive overview of your account’s performance. You’ll see key metrics like impressions, engagement rate, profile visits, and follower growth. You can also adjust the date range to see how these metrics trend over time, giving you a more granular view of your performance.
Accessing Insights on Mobile
While the full analytics dashboard is desktop-based, you can still access valuable data on your mobile device. The Twitter Analytics Guide offers excellent tips on how successful users leverage these insights. In the Twitter app, navigate to any of your tweets and tap the three dots in the upper right corner. Selecting “View Tweet Analytics” reveals impressions, engagements, new followers, and profile visits for that specific tweet.
This mobile view provides a quick snapshot of individual tweet performance. While less comprehensive than the desktop version, it allows you to monitor your content’s impact on the go, particularly useful for assessing the immediate reaction to your posts.
Utilizing Third-Party Tools
Beyond Twitter’s native analytics, numerous third-party tools offer enhanced features and insights. These often include advanced filtering, customizable reports, and competitive analysis capabilities, which can be particularly helpful for businesses and professionals seeking a more in-depth understanding of their Twitter performance.
Popular options include Hootsuite and Buffer. These platforms integrate with Twitter to provide a more holistic view of your data, allowing you to track metrics across multiple social media channels. For example, Hootsuite lets you create custom dashboards and track campaign ROI, features not available in Twitter’s native analytics.
Understanding Account Differences
The level of analytics access depends on your account type. While all accounts can see basic tweet-level data, professional accounts typically have access to more detailed metrics and historical data. This granular information enables more in-depth analysis and strategic planning.
For example, a business with a professional account can analyze conversion events to track the effectiveness of marketing campaigns. This detailed analysis reveals which marketing efforts drive tangible results, allowing professionals to refine their strategies and maximize their impact on Twitter.
To help summarize the different access methods, let’s look at a comparison table:
Twitter Analytics Access Methods Comparison
This table compares different ways to access Twitter Analytics, highlighting the pros and cons of each method.
| Access Method | Available Metrics | Ease of Use | Best For | Limitations |
|---|---|---|---|---|
| Desktop Dashboard (analytics.twitter.com) | Comprehensive overview of account performance: impressions, engagement rate, profile visits, follower growth, tweet activity, video views, etc. | Easy to navigate and offers detailed visualizations. | In-depth analysis, historical data review, strategic planning | Requires a computer and internet access. |
| Mobile App (in-app Tweet Analytics) | Tweet-specific metrics: impressions, engagements, new followers, profile visits. | Quick and convenient access on the go. | Monitoring individual tweet performance, assessing immediate impact. | Limited data compared to the desktop dashboard. |
| Third-Party Tools (e.g., Hootsuite, Buffer) | Varies based on the tool but often includes advanced filtering, custom reports, competitive analysis, and cross-platform data aggregation. | Can vary in complexity but generally user-friendly. | Enhanced analytics, deeper insights, managing multiple social media accounts. | May require a subscription fee. |
This table highlights the trade-offs between convenience and the depth of information available through each access method. Choosing the right method depends on your specific needs and goals.
Decoding Your Numbers: Metrics That Actually Matter
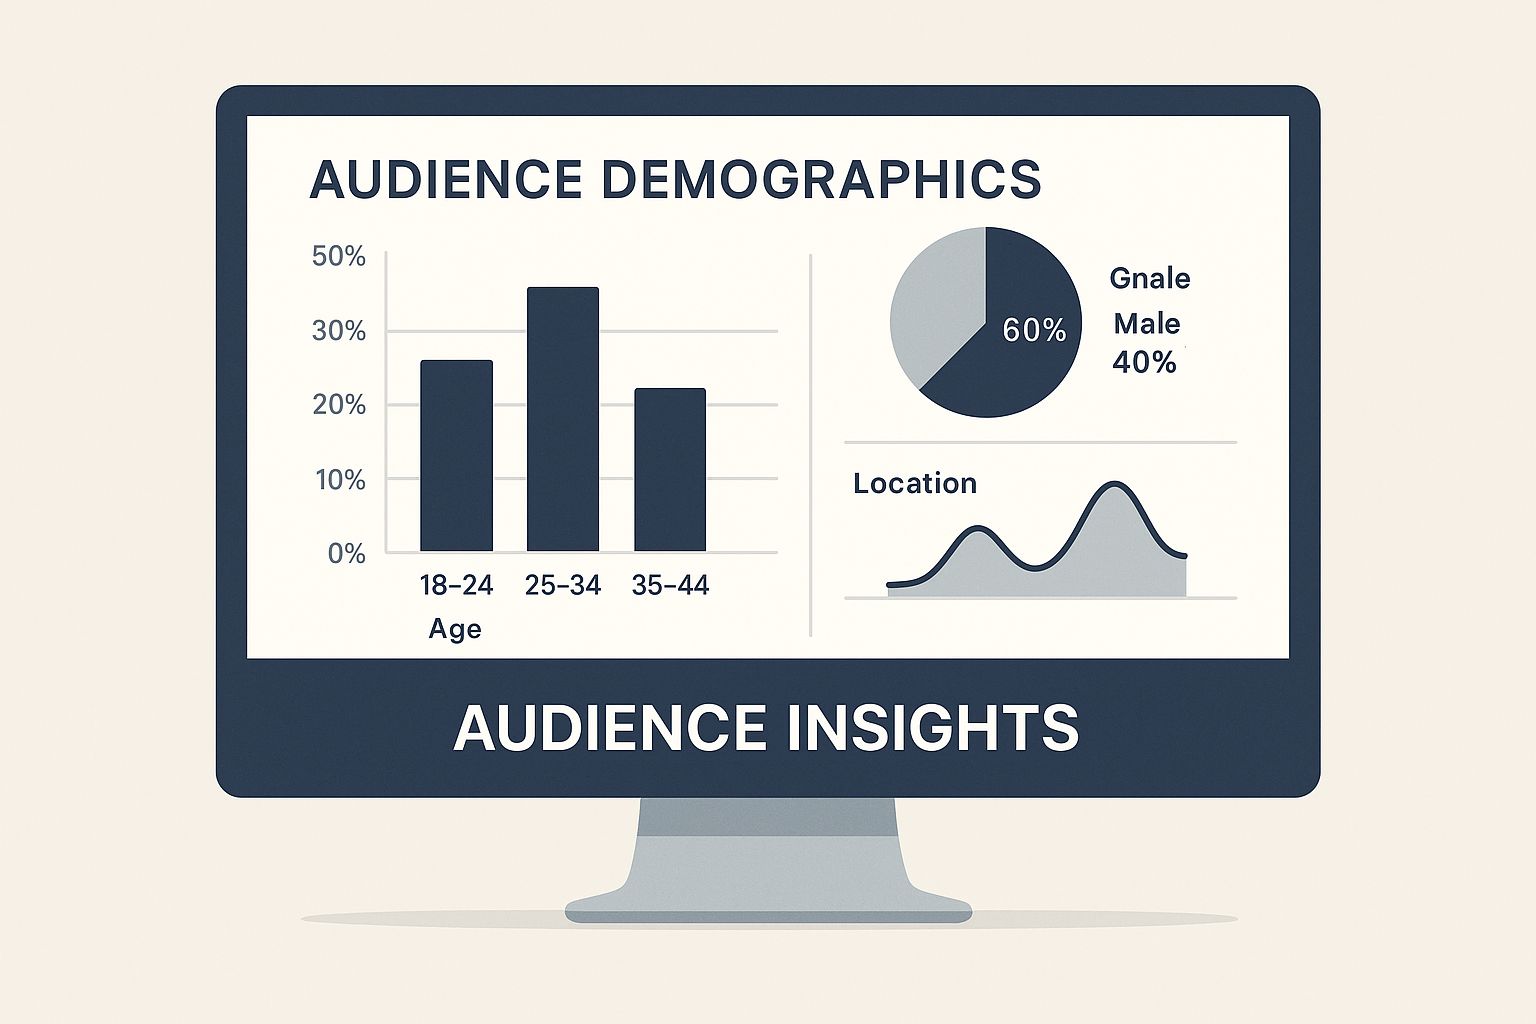
This infographic visualizes audience demographics, displaying graphs and charts related to “Audience Insights.” These insights are essential for understanding your audience and their preferences. By analyzing these demographics, you can refine your content to resonate with your target audience and improve engagement.
Understanding your Twitter performance goes beyond simply tracking your follower count. It’s about diving into the data that truly drives success. Analyzing these Key Performance Indicators (KPIs) is the first step towards optimizing your content and achieving your Twitter objectives. Think of these metrics as your guide to a more effective Twitter strategy.
Impressions, Engagement, and Profile Visits: The Trifecta
Impressions represent the number of times your tweets appear on users’ timelines. This metric offers a glimpse into your content’s potential reach. However, a high impression count isn’t the only key to success.
Engagement is where your content truly comes to life. This encompasses likes, retweets, replies, mentions, and follows, providing valuable insights into how your audience interacts with your tweets. A high engagement rate signals that your content is resonating with your followers.
Profile visits indicate how effectively your tweets drive traffic to your profile. This metric reflects the interest generated by your content and can be a strong predictor of potential follower growth. A consistent uptick in profile visits often precedes an increase in followers.
The interplay of impressions, engagement, and profile visits paints a comprehensive picture of your content’s performance. For example, a tweet with high impressions but low engagement may indicate a need to refine the messaging or experiment with different content formats.
Follower Growth and Its Significance
While not the sole measure of success, follower growth demonstrates the expansion of your Twitter audience. Sustainable growth comes from consistently delivering valuable and engaging content.
Analyzing Twitter usage statistics can provide valuable context. Twitter boasts millions of monthly and daily active users, establishing it as a potent platform for brand promotion. For a deeper dive into these statistics, visit Business of Apps.
Benchmarking for Success
To accurately assess your Twitter performance, establish relevant benchmarks. These benchmarks vary depending on your account type, audience size, and the type of content you share. Industry leaders often tailor their benchmarks based on these factors to gain a clearer understanding of their performance, allowing for a more precise evaluation and the identification of areas for improvement.
Identifying Trends and Patterns
Even small metric fluctuations can signal shifts in audience behavior. Analyzing these fluctuations can uncover trends and patterns, revealing which content truly resonates. This involves distinguishing between content that generates passive views and content that sparks genuine interaction. This analysis helps refine your content strategy for maximum engagement. For more on data analysis, explore this guide on Data Analytics for Marketers.
To better understand the metrics discussed, let’s examine them in more detail. The following table provides definitions, calculations, insights, and industry averages for key Twitter engagement metrics.
Twitter Engagement Metrics Explained
This table breaks down different engagement metrics, what they mean, and how to calculate them.
| Metric | Definition | How It’s Calculated | What It Tells You | Industry Average |
|---|---|---|---|---|
| Engagement Rate | Measures how actively users interact with your content | (Total Engagements / Impressions) * 100 | How well your content resonates with your audience | 1-3% |
| Likes | Number of times users “like” your tweets | Direct count of likes | Level of positive sentiment towards your content | Varies widely |
| Retweets | Number of times users share your tweets with their followers | Direct count of retweets | How shareable and impactful your content is | Varies widely |
| Replies | Number of direct responses to your tweets | Direct count of replies | Level of conversation and interaction generated by your content | Varies widely |
| Mentions | Number of times users mention your account in their tweets | Direct count of mentions | How often your brand is being discussed | Varies widely |
| Profile Clicks | Number of times users click through to your profile from your tweets | Direct count of profile clicks | How effectively your tweets drive traffic to your profile | Varies widely |
Understanding these metrics and their industry averages helps you benchmark your performance and identify areas for improvement. By focusing on these key insights, you can refine your Twitter strategy for greater success.
Understanding Your Audience: Beyond Basic Demographics

A successful Twitter strategy requires a deep understanding of your audience. It’s more than just surface-level demographics like age and location. You need to understand why people engage with your content. Twitter Analytics helps you uncover not just who your followers are, but also their motivations and behaviors on the platform. This knowledge is key to transforming your content strategy and maximizing your impact.
Creating Audience Personas With Twitter Data
To assess your Twitter performance effectively, it’s important to understand which metrics truly matter. Resources like this guide on Data Analytics for Marketers can be incredibly helpful. Combining demographic data with behavioral patterns allows you to create detailed audience personas. These personas are fictional representations of your ideal followers, embodying their interests, motivations, and pain points.
For example, imagine you’re a SaaS company targeting small business owners. Your persona might be a tech-savvy entrepreneur who values efficiency and cost-effectiveness. By understanding these characteristics, you can tailor your content to resonate with their specific needs. This targeted approach leads to increased engagement and builds stronger connections with your audience.
Identifying Micro-Trends in Engagement
Expert marketers often look for micro-trends in engagement. These subtle shifts in engagement timing, content preferences, and interaction types can offer valuable insights. For example, a consistent spike in engagement on weekends might suggest that your audience is more receptive to leisure-related content during that time.
Analyzing which tweets generate the most replies reveals the topics that resonate most with your followers. This information helps you optimize your content calendar and posting schedule for maximum impact. Twitter Analytics also provides demographic data, including location, gender, and interests, allowing you to further refine your content strategy. With the average daily usage around 11 minutes per user, maximizing engagement within those short bursts of attention is crucial. Backlinko offers more detailed statistics on Twitter usage.
Tracking Audience Evolution Over Time
Audience behavior is dynamic and constantly evolving. Continuously tracking your audience’s evolution is crucial for adapting your strategy and maintaining relevance. You might notice new segments emerging within your audience requiring a different approach.
This could involve creating targeted content for specific subgroups or adjusting your overall messaging to address shifting interests. This proactive approach keeps you ahead of the curve and ensures your content continues to resonate with your evolving target audience. By monitoring these changes and adapting accordingly, you ensure your message remains relevant and engaging.
Pro-Level Analytics: Strategies for Serious Growth
Moving beyond basic impressions and engagement, this section explores advanced Twitter analytics strategies used by professionals to achieve significant growth. We’ll discuss how to use analytics for measurable business outcomes, shifting the focus from vanity metrics to data-driven decisions.
Measuring Conversion Events and Tracking Campaign ROI
For businesses, conversion events are key indicators of success. These events, such as website visits, newsletter signups, or product purchases, reveal which Twitter activities directly impact your bottom line. This data is essential for calculating the Return on Investment (ROI) of your Twitter marketing campaigns.
By analyzing which tweets and campaigns drive the most conversions, you can optimize your budget and prioritize the most effective strategies. This data-driven approach ensures your Twitter efforts translate into tangible business results. For more information, you might be interested in our sitemap.
Integrating Twitter Data With Your Broader Marketing Ecosystem
Twitter analytics shouldn’t be isolated. Integrating this data with your broader marketing ecosystem provides a comprehensive view of the customer journey. This involves connecting your Twitter data with platforms like Google Analytics, CRM systems, and other marketing tools.
For example, tracking website traffic from Twitter helps identify which tweets and campaigns effectively drive users to your site. This integrated approach allows you to measure the overall impact of your Twitter presence on your business goals.
Exporting and Analyzing Custom Data Sets
While the standard Twitter dashboard offers a general overview, exporting custom data sets allows for more in-depth analysis. This unlocks the potential to identify deeper insights and trends not readily visible in the standard interface.
Manipulating this data in spreadsheets or other analytical tools like Tableau can uncover hidden patterns and correlations to inform your strategy. This deeper dive empowers you to make more informed decisions based on a comprehensive understanding of your Twitter data.
Benchmarking Against Competitors and Identifying Industry Trends
Context is crucial for understanding your performance. Benchmarking against competitors shows how you compare within your industry. This allows you to identify your strengths and areas for improvement.
Furthermore, tracking industry trends via Twitter analytics helps you anticipate changes in audience behavior and adapt your content strategy accordingly. This proactive approach ensures you stay ahead of the curve and maintain a competitive edge. The importance of analytics is highlighted by Twitter’s extensive reach. As of early 2025, Twitter’s advertising reach was 586 million users globally, representing 7.1% of the eligible global population. You can find more detailed statistics here.
Leveraging Twitter Card Analytics for Off-Platform Impact
Twitter Cards enrich your tweets with rich media and calls to action, encouraging users to engage with your content off-platform. Tracking the performance of these cards is essential for understanding their effectiveness.
Analyzing metrics like click-through rates and conversions lets you optimize your Twitter Card design and messaging to maximize off-platform engagement. This extends the reach of your Twitter presence and drives traffic to other important online properties.
Turning Insights Into Action: Your Strategic Roadmap
Data without action offers little value. This section bridges the gap between analyzing Twitter analytics and achieving tangible results, providing a practical framework for implementing your newfound knowledge. We’ll explore how effective Twitter strategists transform data insights into actionable content decisions, significantly boosting engagement and achieving their objectives.
Optimizing Your Posting Schedule Based on Audience Activity
Understanding when your audience is most active is crucial for maximizing your content’s reach. Twitter Analytics reveals peak engagement times, allowing you to tailor your posting schedule accordingly. This is similar to a shopkeeper opening their store during peak business hours. Imagine if they were closed when most shoppers were ready to buy – they’d miss valuable opportunities. Similarly, tweeting when your audience is most active significantly increases the chances of your content being seen and interacted with. For additional information, consider reading: How to master your sitemap.
If your analytics reveal a consistent spike in engagement on weekday evenings, prioritize posting during those times. This strategic approach ensures your tweets reach the maximum number of followers when they’re most likely to interact, resulting in more likes, retweets, and replies, thus amplifying your message and broadening your reach.
Refining Content Formats for Maximum Impact
Different types of content perform differently. Twitter Analytics helps identify which formats resonate most with your followers. This might involve analyzing the performance of various media types, such as images, videos, or text-based tweets. Experimenting with different tweet lengths and styles is also beneficial to see what generates the most engagement.
If data shows that your video tweets consistently outperform text-based posts, consider incorporating more video content into your strategy. This data-driven approach ensures you’re providing the content your audience prefers, leading to higher engagement and a stronger connection with your followers.
Identifying Trend Opportunities Before They Peak
Staying ahead of the curve means identifying emerging trends. Twitter Analytics helps spot these opportunities before they hit the mainstream. This involves monitoring trending hashtags, analyzing conversations around relevant topics, and tracking the performance of tweets related to emerging trends. This proactive approach allows you to capitalize on trending topics and participate in relevant conversations.
This early adoption can significantly increase your visibility and position you as an authority in your niche. By creating timely and relevant content, you can attract a wider audience and solidify your presence on the platform. This strategic use of Twitter analytics lets you ride the wave of trending topics, gaining more exposure and engagement for your content.
Continuous Data-Informed Refinements for Long-Term Growth
Like a gardener tending their plants, consistent nurturing of your Twitter presence is essential for long-term growth. Twitter Analytics helps you systematically improve your performance through continuous data-informed refinements.
This iterative process involves regularly monitoring your metrics, analyzing trends, and adapting your strategy based on the insights gathered. This ongoing cycle of analysis and adjustment ensures your content remains relevant, engaging, and effective in achieving your Twitter objectives.
Ready to transform your Twitter strategy and connect with the right influencers? REACH Influencers empowers you to launch targeted campaigns and collaborate with content creators who align with your brand. Visit REACH Influencers today to learn more and unlock the full potential of influencer marketing.
