

Decoding Social Media Engagement: What Actually Matters Now

Successfully navigating the complexities of social media requires a deep understanding of what truly drives meaningful engagement. It’s not just about racking up likes and followers; it’s about cultivating genuine connections with your audience. A thoughtful comment that demonstrates real understanding of your content is far more valuable than a flood of superficial likes.
This shift in focus from vanity metrics to meaningful interactions represents a significant evolution in how we measure success on social media. It’s about quality over quantity.
Key Metrics for Measuring Engagement
So, what are the key metrics that actually signify genuine interaction? These metrics provide valuable insights into how your audience is connecting with your content.
- Likes and Reactions: These offer a quick pulse check on initial interest and positive sentiment toward your posts.
- Comments: Comments, especially insightful ones, reveal a deeper level of engagement and provide valuable feedback. They show that your audience is thinking about and responding to your message.
- Shares and Retweets: When your audience shares your content, they amplify your message and introduce it to a wider network, demonstrating its perceived value.
- Saves: A saved post indicates a desire to revisit the content later, suggesting a lasting impact and resonance with the user.
- Clicks and Link Interactions: Clicks show active interest in exploring the information or offers you present. This metric demonstrates a desire to learn more.
- Direct Messages (DMs): DMs signal a desire for one-on-one conversation and can be a powerful tool for building valuable customer relationships.
Tracking these actions paints a more accurate picture of your content’s performance and audience engagement. This leads us to the importance of understanding the scale of the social media landscape when evaluating these metrics. Measuring social media engagement is all about quantifying how users interact with the content shared by brands and individuals.
By early 2025, the global social media user base had reached approximately 5.42 billion, with the average person active on nearly 7 different social platforms. This underscores the vast and diverse audience to consider when measuring engagement. For a deeper dive into these statistics, check out this resource: https://sproutsocial.com/insights/social-media-statistics/
Moving Beyond Vanity Metrics
While likes and follower counts might look impressive, they don’t always tell the whole story. Focusing solely on these surface-level metrics can be misleading. A high follower count doesn’t automatically translate into high engagement or tangible business results.
Instead, focus on the quality of interactions. A smaller, highly engaged audience is often more valuable than a large, passive one. Prioritize metrics that reflect genuine interest and action. This approach provides a much more accurate understanding of your true social media impact and helps inform more effective content strategies. By analyzing these deeper metrics, you can refine your content to resonate more effectively and achieve your business objectives.
Platform-Specific Metrics That Drive Real Results
Each social media platform operates differently, shaping unique user behaviors and interactions. What defines “engagement” varies significantly. A retweet on Twitter/X isn’t the same as a save on Instagram. Analyzing successful accounts reveals the true key metrics for each.
Instagram: Visual Storytelling and Community Building
Visuals dominate Instagram. Likes, comments, saves, and shares are crucial engagement metrics. Story views and sticker interactions also reveal audience interest. Instagram’s algorithm prioritizes content that fosters conversation and community, meaning visually appealing, interaction-driving content is key.
Facebook: Fostering Discussions and Driving Traffic
Facebook focuses on discussions and driving external website traffic. Reactions, comments, shares, and link clicks are key metrics. Facebook Groups are also important, so track group participation and post reach.
TikTok: Virality and Trend Participation
TikTok thrives on short videos and trends. Video views, likes, comments, shares, duets, and stitches indicate content resonance. Given the platform’s virality focus, tracking content spread speed is essential. Understanding ROI is also key; learn more about calculating Influencer Marketing ROI.
LinkedIn: Professional Networking and Thought Leadership
LinkedIn is for professional networking. Engagement revolves around comments, shares, and connection requests. Meaningful discussions and comments outweigh simple likes. Building a professional network and sharing valuable content is key.
Twitter (X): Real-Time Conversations and Brand Mentions
Twitter, now X, prioritizes real-time conversations. Retweets, replies, and mentions are crucial. Monitoring brand mentions and joining relevant conversations can boost reach and visibility. Each platform offers unique metrics and user behaviors, requiring platform-specific benchmarks and KPIs. For instance, Instagram’s average engagement rate is around 4.2%, while LinkedIn’s is 2.8%, reflecting different user interaction norms. SproutSocial provides more detailed social media statistics.
Visualizing Key Engagement Metrics
The following table compares key engagement metrics across different platforms:
Social Media Platform Engagement Metrics Comparison: A comprehensive comparison of key engagement metrics across major social media platforms
| Platform | Primary Engagement Metrics | Average Engagement Rate | Best Content Formats | Measurement Tools |
|---|---|---|---|---|
| Likes, Comments, Saves, Shares, Story Views | 4.2% | Images, Short Videos, Stories | SproutSocial | |
| Reactions, Comments, Shares, Link Clicks | Varies | Text, Images, Videos, Live Streams | Facebook Insights | |
| TikTok | Views, Likes, Comments, Shares, Duets, Stitches | Varies | Short-Form Videos | TikTok Analytics |
| Comments, Shares, Connection Requests | 2.8% | Text, Articles, Videos | LinkedIn Analytics | |
| Twitter (X) | Retweets, Replies, Mentions | Varies | Short-Form Text, Images, Videos | Twitter Analytics |
This table highlights the platform-specific nature of engagement and the need for tailored measurement strategies.
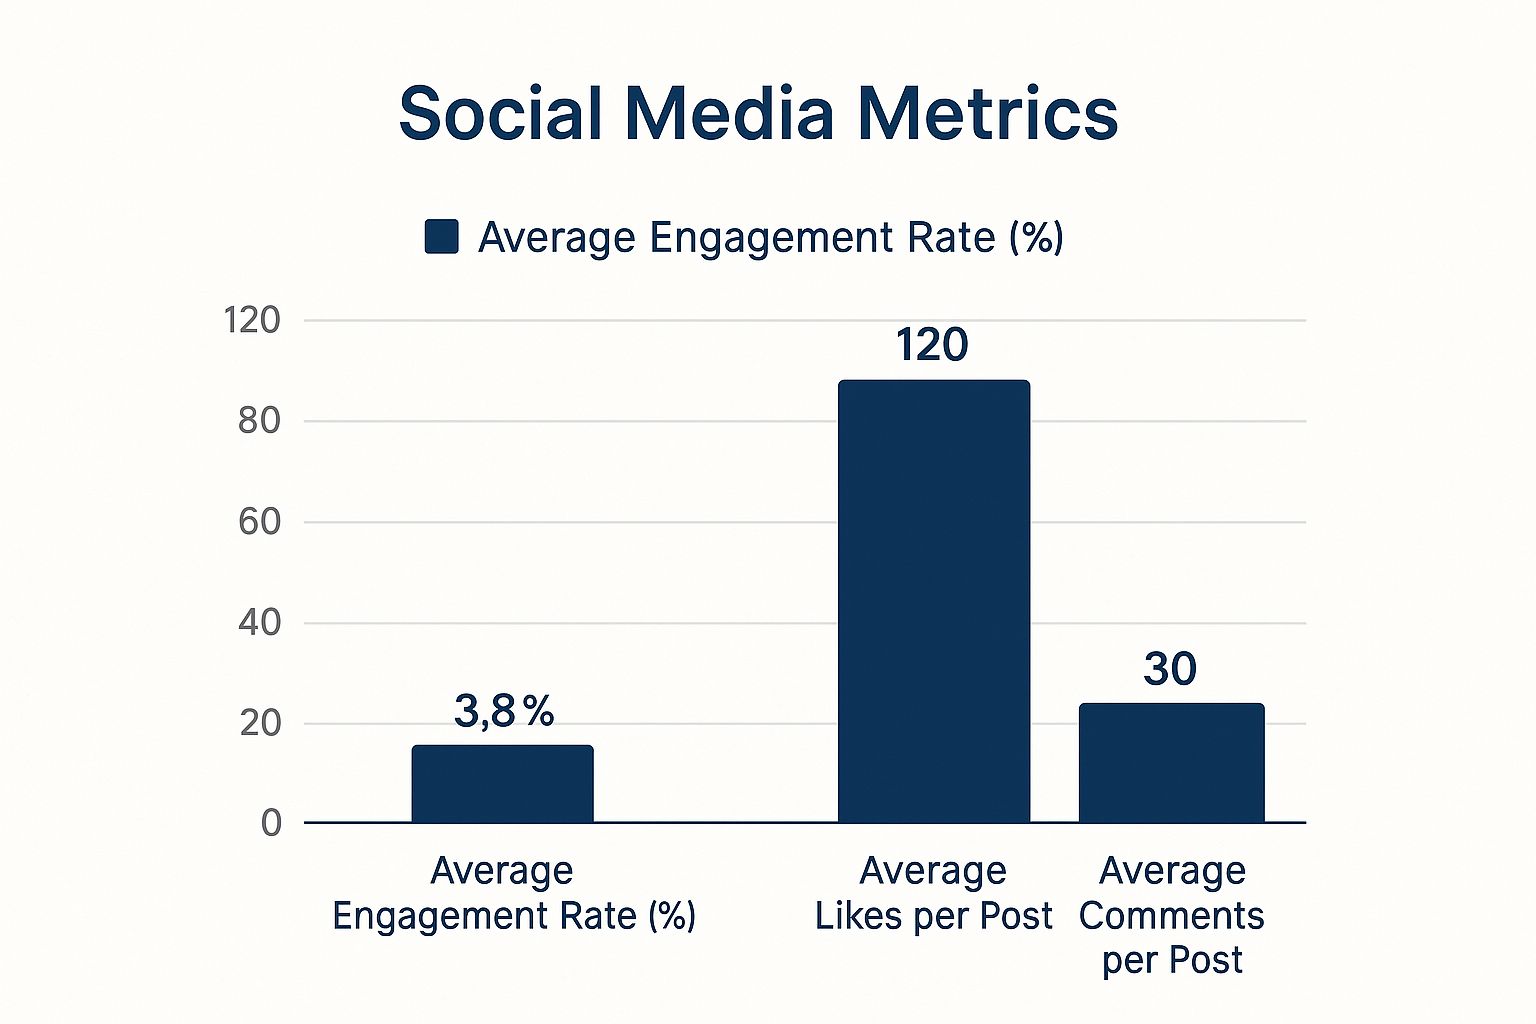
This graph compares average engagement rate (3.8%), average likes per post (120), and average comments per post (30). Likes show basic interest, comments indicate deeper engagement, and the engagement rate provides context. Considering multiple metrics gives a comprehensive view of audience interaction. By focusing on platform-specific metrics and understanding each network’s nuances, you can tailor your measurement approach and optimize your strategy for better results.
Building Your Engagement Measurement Framework

Stop guessing about the effectiveness of your social media strategy. This section provides the tools and techniques you need to accurately measure social media engagement and understand what truly resonates with your audience. We’ll explore various calculation methods and discuss when to use each one. This empowers you to move beyond vanity metrics and focus on driving real business outcomes.
Choosing the Right Calculation Method
There isn’t a one-size-fits-all approach to calculating engagement rates. Different methods provide different perspectives. The key is understanding which method best suits your particular goals.
- Engagement Per Follower: This common method divides total engagement (likes, comments, shares, etc.) by your follower count. It provides a general overview of how your audience interacts with your content.
- Engagement Per Impression: This method calculates engagement based on the number of times your content was displayed. It helps assess how compelling your content is at capturing attention.
- Engagement Per Reach: Reach measures the number of unique users who saw your content. Calculating engagement per reach helps understand how effectively your content is spreading organically. You might be interested in: our sitemap for more category guides.
For example, if a post receives 100 engagements and reaches 1,000 unique users, your engagement per reach would be 10%. This demonstrates how effective your content is at stimulating interaction among those who see it.
Establishing Meaningful Benchmarks
Comparing your engagement rates to industry averages or competitors can be helpful. However, it’s important to establish benchmarks relevant to your specific audience size and industry. A small business with a niche audience shouldn’t compare itself to a multinational corporation with millions of followers.
Additionally, recent shifts in social media usage have significantly impacted engagement rates. Between 2024 and early 2025, platforms like Facebook, Instagram, TikTok, and Twitter (now X) saw substantial declines in engagement. Facebook’s engagement dropped by 36%, while X experienced the steepest fall at 48%. These changes underscore the need for dynamic and adaptable engagement measurement strategies. Discover more insights about social media industry benchmarks. To effectively leverage social media for results, understanding how to measure and then improve your engagement is crucial. For proven tactics to boost engagement, check out this article on how to increase social media engagement.
Setting Up Tracking Systems
Tracking engagement manually can be time-consuming and inefficient. Utilize social media management tools or analytics platforms to automate data collection and visualize trends. This allows you to identify patterns in your engagement data, understand what type of content performs best, and refine your strategy accordingly. By monitoring these trends, you can continually optimize your content and maximize your social media impact.
Industry Benchmarks: Setting Realistic Engagement Goals
Comparing your brand’s social media engagement to vastly different industries isn’t helpful; it’s misleading. Imagine comparing a local bakery’s engagement to that of a global tech giant. Their audience size, content strategy, and overall goals are entirely different. Understanding industry benchmarks is critical for setting realistic engagement goals.
The Impact of Industry on Engagement
Engagement benchmarks differ significantly across sectors. A fashion brand thrives on visually appealing content, while a B2B software company focuses on thought leadership and providing solutions. This translates to different engagement patterns. Fashion brands might see higher engagement on visually-driven platforms like Instagram, while B2B companies may find more success on LinkedIn. You might be interested in learning more about influencer marketing strategies on our sitemap.
For example, a fashion brand might measure success by the number of saves and shares on Instagram showcasing new outfits. A software company prioritizes website clicks from a LinkedIn post about a new white paper. Each industry has its own unique “language” of engagement.
Regional Nuances in Social Media Engagement
Even within the same industry, geographic location plays a significant role. Cultural differences and varying levels of social media adoption impact how audiences engage with content. A campaign that resonates in North America might not have the same impact in Southeast Asia. Understanding local digital behavior is essential.
Posting frequency and preferred platforms can also vary by region. Regional and industry-specific factors are critical when measuring social media engagement. For example, in 2025, North American brands averaged 9.5 posts per day on Instagram, resulting in an average of 27 daily interactions. On TikTok, those same brands averaged only 4 daily interactions. North American government accounts saw over 3,100 daily interactions, while automotive accounts received just 2. More detailed statistics can be found on SproutSocial.
To further illustrate these variations, let’s look at a statistical breakdown:
The following table provides a glimpse into engagement patterns across different industries and regions.
Industry & Regional Engagement Benchmark Data: Statistical breakdown of engagement rates across different industries and geographic regions.
| Industry/Region | Average Engagement Rate | Posting Frequency | Top-Performing Content Types | Engagement Trends |
|---|---|---|---|---|
| North America – Fashion | 1.5% | 3 posts/day | High-quality images, Reels, Stories | Short-form video, influencer marketing |
| North America – B2B Software | 0.8% | 1 post/day | Articles, white papers, webinars | Thought leadership, community building |
| Southeast Asia – Fashion | 2.0% | 5 posts/day | Live videos, interactive polls | Community engagement, influencer collaborations |
| Southeast Asia – B2B Software | 0.5% | 2 posts/day | Case studies, blog posts | Relationship building, targeted advertising |
This table demonstrates how engagement rates, posting frequency, and preferred content types can change dramatically based on industry and region. Fashion brands tend to have higher engagement rates, particularly in Southeast Asia, and rely heavily on visual content. B2B software companies, on the other hand, see lower engagement rates and focus on sharing valuable information.
Competitive Benchmarking: Finding Your Place
Beyond industry and regional averages, competitive benchmarking provides the most relevant insights. Analyzing the social media performance of your direct competitors helps you understand your market position. This allows you to identify areas for improvement and set achievable goals based on real-world data within your specific niche.
Competitive benchmarking isn’t about blindly copying competitors. It’s about gaining a clearer understanding of what works within your specific market and adapting your strategy accordingly. This might involve analyzing their content formats, posting frequency, and engagement strategies.
Setting Realistic Goals
By understanding your industry, region, and competitors, you can move away from chasing arbitrary numbers and focus on setting goals aligned with your business objectives. Instead of aiming for a generic “high engagement rate,” define what engagement truly means for your brand. Is it driving website traffic? Generating leads? Building brand awareness?
Once you have a clear definition of success, you can develop a targeted social media strategy and track the metrics that matter. This targeted approach ensures you’re not just measuring engagement for its own sake but using it as a tool to achieve meaningful business results.
Beyond Numbers: Measuring Engagement Quality That Matters

While quantitative metrics like likes, comments, and shares offer a basic understanding of social media engagement, they don’t tell the whole story. Truly understanding engagement requires a deeper dive into the quality of these interactions. This means shifting focus from simply counting clicks to evaluating the depth and authenticity of the connections you’re building. For instance, one thoughtful comment can hold significantly more value than numerous superficial likes.
Evaluating Comment Sentiment: Understanding the “Why” Behind the Numbers
Analyzing comment sentiment illuminates the reasoning behind the numbers. Are the comments positive, negative, or neutral? This qualitative analysis adds valuable context to quantitative data. A high comment count might initially appear positive, but if the sentiment is largely negative, it could indicate a problem. This highlights the importance of addressing underlying issues and adapting your message accordingly.
Social listening tools are invaluable for this type of analysis. These tools offer automated sentiment analysis, processing large volumes of comments and providing an overall sentiment score. This gives you a clear picture of public perception.
Identifying Valuable Community Members: Recognizing Your Brand Advocates
Beyond overall sentiment, identifying valuable community members is crucial. These individuals consistently engage with your content, providing insightful comments and sharing your posts. They are your brand advocates, and nurturing these relationships is key to fostering authentic engagement and building a strong community.
This might involve thoughtfully responding to their comments, featuring them in your content, or offering exclusive opportunities. Building genuine connections with these key individuals can significantly impact your brand’s online presence.
Measuring Authentic Brand Advocacy: Moving Beyond Likes and Shares
Authentic brand advocacy extends beyond simple likes and shares. It signifies genuine support for your brand and a willingness to recommend it to others. Measuring this qualitative engagement can be achieved through several methods:
- Analyzing user-generated content: How frequently are users creating content related to your brand? What is the overall sentiment of this content?
- Tracking brand mentions: Are users discussing your brand organically? What is the context surrounding these mentions?
- Monitoring online reviews: Are customers leaving positive reviews on platforms like Google or Yelp?
These metrics offer a more nuanced understanding of your brand’s true influence and the level of authentic advocacy you’ve built. You might be interested in: our tag sitemap for additional insights.
Combining Qualitative and Quantitative Data: Building a Holistic View of Engagement
Leading brands integrate both qualitative and quantitative approaches to form a comprehensive understanding of their audience connections. Quantitative data tracks overall trends and identifies areas for improvement, while qualitative data delves into the reasons behind these trends.
This combined approach allows brands to refine their social media strategies and build meaningful relationships that contribute to business growth. By carefully analyzing both the what and the why of social media engagement, brands can cultivate stronger connections and achieve their business objectives. This approach transcends vanity metrics and creates a genuine community that drives tangible results.
Transforming Engagement Data Into Strategic Action
Measuring social media engagement is crucial, but it’s only the first step. The real power lies in transforming that data into strategic action, driving tangible results. This means moving beyond simply observing numbers and actively using those insights to refine your overall strategy. Think of your engagement data as a compass, guiding you toward more effective social media practices.
Identifying Patterns in High-Performing Content
Your engagement data offers a wealth of knowledge about what resonates with your audience. By analyzing patterns in your high-performing content, you can identify key elements that drive engagement. This might involve examining content formats, topics, posting times, or even the specific language used. For example, you could discover that video content consistently outperforms image posts, or that posts published on Tuesdays at 10 AM generate significantly more engagement.
Once you’ve identified these patterns, you can incorporate them into your future content strategy. This data-driven approach allows you to create content more likely to resonate with your audience and achieve your desired outcomes. This isn’t about guessing; it’s about knowing.
Optimizing Posting Strategies Based on Engagement Trends
Engagement trends can fluctuate over time. External factors, changes in platform algorithms, and evolving audience preferences can all impact how users interact with your content. Continuously monitoring engagement trends is therefore essential for optimizing your posting strategy.
For instance, you might notice a dip in engagement during a particular time of year. This could indicate a need to adjust your content calendar or experiment with different posting times. A sudden surge in engagement on a specific type of content suggests an opportunity to capitalize on that trend. By staying adaptable and responsive to engagement trends, you can ensure your social media strategy remains effective.
Aligning Social Metrics With Broader Business Objectives
Social media engagement shouldn’t exist in isolation. It’s essential to align your social metrics with your broader business objectives. This means defining how social media contributes to your overall business goals.
Are you aiming to increase brand awareness? Drive website traffic? Generate leads? Your social media metrics should reflect these objectives. If your goal is to drive website traffic, then click-through rates become a key performance indicator. If you’re focused on building brand awareness, then reach and impressions are more relevant. By aligning your social media efforts with your business goals, you ensure your engagement data translates into meaningful business results.
Practical Approaches for Continuous Improvement
Putting data into action requires a structured approach. Here are some practical methods for leveraging your engagement insights:
- Engagement Audits: Regularly conduct thorough audits of your social media performance. This involves analyzing your engagement data across all platforms to identify areas for improvement.
- A/B Testing: Use your data to inform A/B testing on your content. Experiment with different headlines, visuals, and calls to action to see what resonates best.
- Feedback Loops: Create feedback loops to continuously refine your strategy. Analyze the results of your experiments, make adjustments, and continue monitoring the impact.
These practical approaches ensure your social media strategy remains dynamic and responsive to your audience’s needs.
By implementing these strategies, businesses of all sizes can transform their engagement data into a powerful tool for growth. Whether you’re a small startup or a large enterprise, understanding how to measure and leverage your social media engagement is crucial for success in today’s competitive online landscape.
Ready to take your influencer marketing to the next level? REACH Influencers connects brands with passionate content creators to drive authentic engagement and achieve measurable results. Visit REACH Influencers today to learn more and start building meaningful partnerships.
