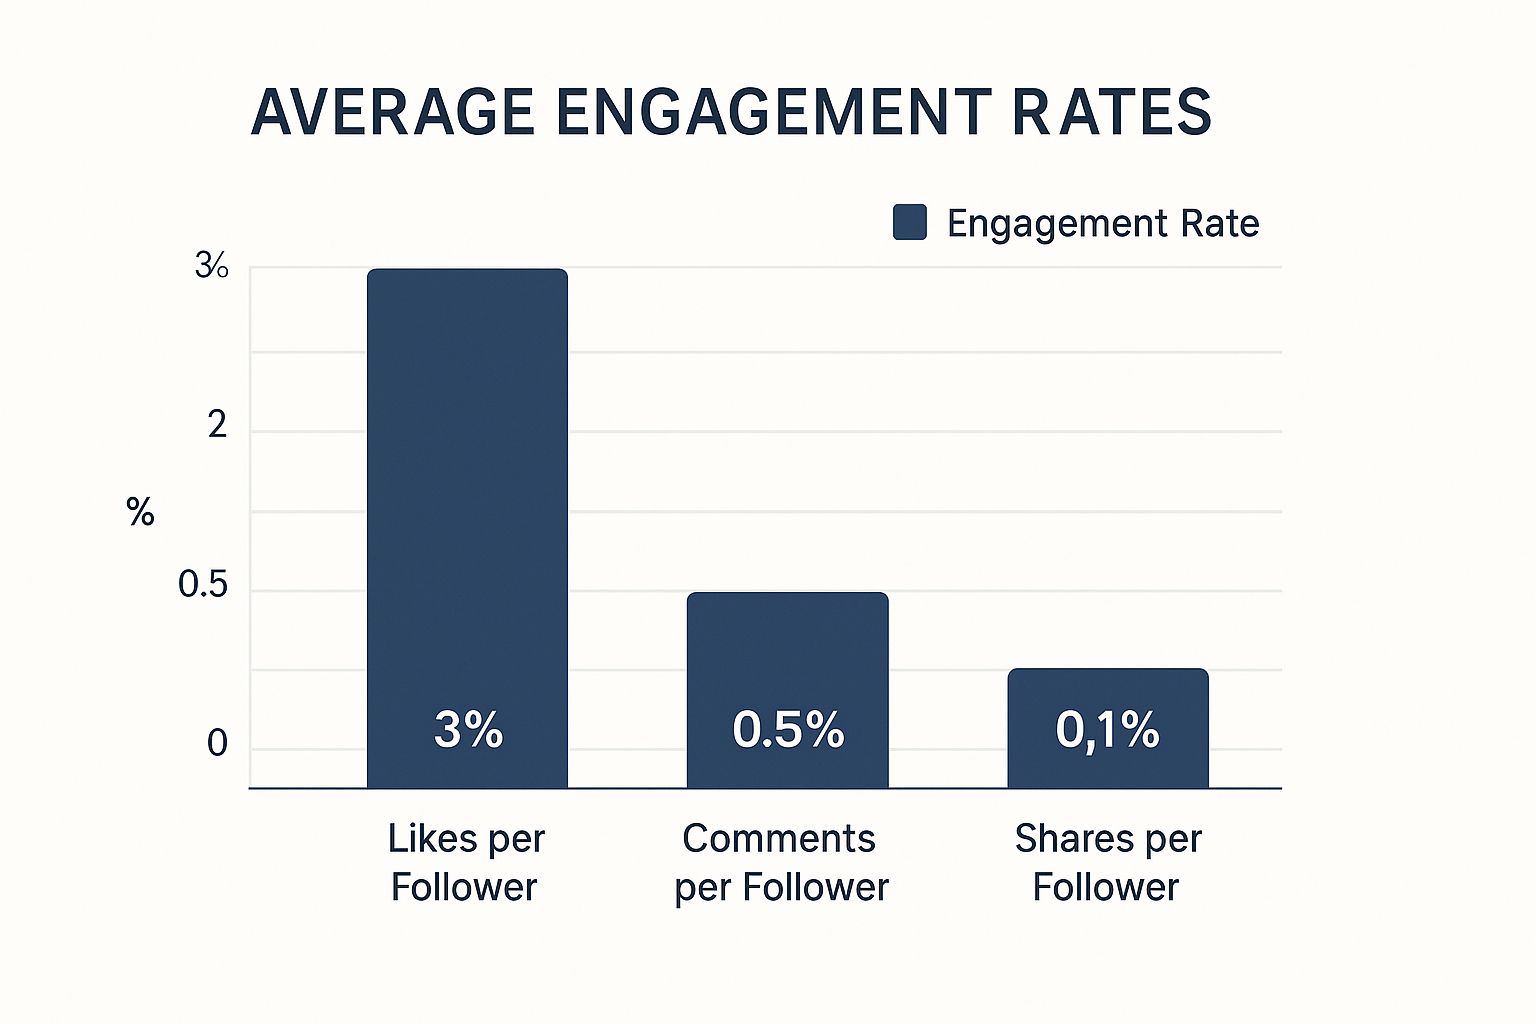
The Real Power Behind Engagement Rate Calculators
An influencer engagement rate calculator is more than a simple tool. It offers valuable insights into the genuine connection between a creator and their audience. Smart marketers are shifting their focus from vanity metrics like follower count and prioritizing engagement as the true indicator of influence. Why? Because genuine engagement leads to tangible results. It signifies an active and interested audience, one that is more inclined to become customers. This shift toward engagement-focused strategies is making influencer marketing a data-driven discipline.
Why Engagement Matters More Than Follower Count
Follower count can be deceptive. A large following doesn’t necessarily equate to an engaged audience. Imagine a packed stadium compared to a small, dedicated fan club. The smaller, genuinely invested group is more likely to take action, whether that’s cheering, buying merchandise, or trying a recommended product. Influencer engagement rate calculators help brands find these dedicated fan clubs, regardless of their size. This allows for more targeted and effective campaigns.
Understanding Engagement Rate
Engagement rate is the percentage of an influencer’s audience that interacts with their content. It measures how many likes, comments, shares, and saves a post receives compared to the influencer’s reach or follower count. This metric provides a deeper understanding of an influencer’s real impact. For example, an influencer with 10,000 followers and 500 engagements per post has a 5% engagement rate. This indicates a higher level of audience interest than an influencer with 100,000 followers and the same 500 engagements, resulting in a lower 0.5% engagement rate. Influencer engagement rates on platforms like Instagram are constantly analyzed. Average engagement rates on Instagram differ considerably depending on follower count. As of 2025, accounts with over 1 million followers average about 1.97%, while those with 100,000 to 1 million see slightly higher rates at 2.05%. This decrease in engagement with increasing follower count highlights the challenges larger accounts face in maintaining audience interaction. The standard Instagram engagement rate formula for feed posts involves calculating the sum of likes, comments, shares, and saves, divided by the total number of followers, then multiplied by 100. Find more detailed statistics here: Phlanx Engagement Calculator.
You might be interested in: REACH Influencers Site Map
The Precision of Engagement Calculators
Precision is key when evaluating potential influencer partnerships. Engagement rate calculators offer this essential accuracy, empowering brands to make informed choices. They eliminate guesswork, allowing marketers to pinpoint influencers who truly connect with their target demographics. This data-driven method minimizes risk and maximizes the potential for campaign success. By focusing on engagement, brands invest in authentic connections, not just large numbers. This results in more meaningful interactions and a better return on investment.
Platform-Specific Calculation Methods That Actually Work
Why does one influencer shine on Instagram while another finds success on TikTok? Understanding the nuances of each platform’s algorithm and, more specifically, applying the correct engagement rate calculation methods, often holds the key. Misinterpreting these calculations can lead to costly errors in your influencer marketing campaigns. This means knowing which metrics truly matter on each platform.
Deciphering the Formulas
Each social media platform has its own unique ecosystem. This requires a tailored approach to engagement analysis. Let’s break down the specific formulas for some of the leading platforms:
- Instagram: This platform necessitates a multi-faceted approach. The standard formula for feed posts is
(Likes + Comments + Saves + Shares) / Followers x 100. However, for Instagram Reels and Stories, views become a crucial part of the equation. This shift accounts for content being seen by a wider audience than just an influencer’s followers. Instagram Engagement Rate varies significantly, not only across different follower counts but also between content types. For example, engagement rates for Instagram Reels are generally higher than those for feed posts. Studies reveal that accounts with 10,000 to 100,000 followers average a 6.89% engagement rate on Reels. This dips to approximately 3.38% for accounts with 1 million to 5 million followers. This suggests the dynamic and interactive format of Reels is highly effective for audience engagement. The formula for Reels incorporates views instead of followers, reflecting how this content type is consumed. - TikTok: This short-form video platform emphasizes views and shares. The core formula is
(Likes + Comments + Shares + Views) / Followers x 100. Given TikTok’s viral potential, reach frequently exceeds follower count, making it a critical factor in campaign analysis. - YouTube: Engagement on YouTube revolves around watch time, comments, and shares. A common formula is
(Total Watch Time + Comments + Shares + Likes) / Views x 100. Understanding audience retention is essential here. A high view count combined with low watch time signifies poor engagement.
Choosing the Right Metrics
Deciding whether to prioritize reach-based calculations or follower-based metrics hinges on your specific marketing goals. If assessing the overall reach of an influencer’s content is your objective, reach-based calculations provide a broader perspective. However, if evaluating the loyalty and engagement of an influencer’s existing audience is more important, follower-based metrics become more relevant.
Visualizing Platform Performance
The following data chart illustrates the average engagement rate differences across different platforms. It visually represents the importance of platform-specific calculations. The chart compares average engagement rate benchmarks for Instagram Feed Posts, Instagram Reels, Instagram Stories, TikTok, and YouTube.
As the data chart indicates, TikTok generally boasts the highest engagement rates, closely followed by Instagram Reels. Instagram Feed posts and YouTube exhibit lower average engagement rates, reflecting different content consumption patterns on these platforms. This underscores the importance of tailoring influencer engagement strategies.
To further illustrate these calculations and benchmarks, let’s examine the following table:
Engagement Rate Calculation Methods By Platform
This table compares the standard engagement rate formulas across major social media platforms, highlighting the differences in calculation methods
| Platform | Standard Formula | Metrics Included | Average Benchmark |
|---|---|---|---|
| Instagram (Feed Post) | (Likes + Comments + Saves + Shares) / Followers x 100 | Likes, Comments, Saves, Shares | ~3.38% (1M-5M Followers) |
| Instagram (Reels) | (Likes + Comments + Saves + Shares + Views) / Views x 100 | Likes, Comments, Saves, Shares, Views | ~6.89% (10k-100k Followers) |
| TikTok | (Likes + Comments + Shares + Views) / Followers x 100 | Likes, Comments, Shares, Views | Varies Widely |
| YouTube | (Total Watch Time + Comments + Shares + Likes) / Views x 100 | Watch Time, Comments, Shares, Likes | Varies Widely |
This table demonstrates how different metrics contribute to engagement calculations on various platforms and how average benchmarks can offer a useful point of comparison.
Identifying Meaningful Interactions
Beyond the numbers, evaluating the quality of engagement is paramount. Meaningful interactions indicate genuine interest. However, vanity metrics, such as likes without comments or shares, can be deceptive. This is where assessing comment sentiment, audience relevance, and brand affinity becomes vital. For instance, numerous comments expressing genuine enthusiasm are more valuable than a large number of generic or bot-generated comments. This qualitative analysis provides deeper insights into the true impact of an influencer’s content. By combining quantitative data with qualitative insights, marketers gain a more comprehensive view of influencer performance and can identify creators who truly resonate with their intended audience.
Benchmarking Success: What Numbers Actually Matter
Stop comparing fashion influencers to fitness creators. It’s comparing apples and oranges. Through the analysis of thousands of campaigns, we uncover the true engagement benchmarks across various industries, creator categories, and platforms. This crucial data helps brands select the right influencers for their specific needs.
Analyzing industry benchmarks helps you effectively use influencer engagement rate calculators.
Why Niche Matters More Than Size
Niche relevance is more important than follower count in influencer marketing. A smaller, highly engaged audience within your target demographic is much more valuable than a massive, disengaged one. Think of it as a specialized boutique versus a generic department store. The boutique caters to specific tastes and fosters stronger customer loyalty. This targeted approach drives meaningful results in influencer marketing.
Realistic Engagement Expectations
Let’s explore realistic engagement expectations for several key verticals:
- Fashion: This industry often has higher engagement due to visually appealing content and trend-driven conversations.
- Beauty: Similar to fashion, beauty thrives on visual appeal, product demonstrations, and tutorials, leading to solid engagement.
- Tech: Tech influencers often generate engagement through product reviews, demonstrations, and discussions about new innovations.
- Finance: This niche may have lower engagement rates due to the serious nature of the content, but highly targeted audiences remain valuable.
- Other Key Verticals: Each industry has its unique engagement patterns. Understanding these nuances is critical for campaign success.
You might be interested in: REACH Influencers Sitemap
The Evolution of Engagement
Influencer engagement benchmarks aren’t static. They evolve with changes in algorithm updates and audience behavior. Staying informed about these shifts is crucial for maintaining accurate expectations. This adaptability is key to maximizing your campaign’s potential. Additionally, influencer engagement rates differ across platforms. For instance, TikTok tends to have higher engagement than Instagram. As of February 2024, TikTok’s average engagement rate was around 3%, with a good rate considered above 5%. This reflects TikTok’s interactive nature. The TikTok engagement rate calculator uses a similar formula to Instagram, dividing interactions by followers, but the platform’s emphasis on short-form videos promotes higher engagement.
Learning from Outliers
Examining outlier case studies, where campaigns significantly outperformed industry averages, offers invaluable lessons. By identifying the factors behind these successes, we extract actionable strategies that you can apply to your influencer selection process. This analysis provides a roadmap for exceptional campaign results. These outliers offer crucial insights into what resonates with audiences.
Factors Influencing Engagement Performance
Several key factors influence engagement performance:
- Content Quality: High-quality, engaging content is paramount. It captures interest and encourages interaction.
- Audience Relevance: Connecting with the right audience is essential. The more relevant your content, the higher the engagement.
- Authenticity: Authenticity builds trust and connection with the audience. Genuine interactions are more valuable than forced engagement.
- Consistency: Posting regularly keeps the audience engaged and reinforces the brand message. Consistent content cultivates anticipation and community.
By understanding these elements, you can refine your influencer selection process and develop more impactful campaigns. These core principles are essential for successful influencer marketing strategies.
Elite Calculator Tools Worth Your Time and Budget
Choosing the right influencer engagement rate calculator can be a daunting task. The market is flooded with options, each boasting different levels of accuracy, features, and pricing. This section helps you navigate this complex landscape and identify the tools that truly deliver. We’ll provide a detailed analysis to help you select the influencer engagement rate calculator that best aligns with your specific needs.
Free vs. Paid: Making the Right Choice
Deciding between a free or paid tool depends on several factors. Free influencer engagement rate calculators are often excellent starting points, especially for those on a tight budget or experimenting with initial campaigns. They offer basic calculations, often sufficient for individual influencers or smaller brands.
However, as your campaigns grow in complexity and scale, a paid tool may become essential. Premium features often include advanced analytics, automated reporting, competitor analysis, and the ability to track historical data. These advanced capabilities can streamline your workflow and unlock valuable strategic insights, justifying the investment.
Key Features to Consider
When evaluating influencer engagement rate calculators, several key features should guide your decision:
- Platform Coverage: Does the tool support the social media platforms relevant to your campaigns? Ensure it covers Instagram, TikTok, YouTube, or any other networks you utilize. Comprehensive platform coverage is vital for a holistic view of influencer performance.
- Integration Capabilities: Seamless integration with your existing marketing tools, such as your social media management platform or CRM system, can significantly improve efficiency. Look for tools that offer these integrations.
- Reporting Features: Robust reporting is crucial for data-driven decision-making. Prioritize tools that provide customizable reports and allow you to export data for further analysis.
- Hidden Limitations: Be mindful of potential limitations in free tools. Some may impose usage caps, restrict certain features, or limit access to historical data. Understand these limitations before committing to a platform.
Top Tools: A Comparative Overview
To help you compare and contrast the available options, we’ve compiled a table summarizing popular influencer engagement rate calculators:
To help you choose the right tool, we’ve compiled a comparison table outlining the key features, pricing, and ideal use cases of popular engagement rate calculators.
Comparison of Popular Engagement Rate Calculator Tools:
This table compares key features, pricing, and capabilities of the most widely used engagement rate calculators in the market.
| Tool Name | Supported Platforms | Key Features | Price Point | Best For |
|---|---|---|---|---|
| Phlanx | Instagram, YouTube, TikTok | Audience demographics, engagement rate calculation | Free and Paid Options | Smaller businesses and individual influencers |
| HypeAuditor | Instagram, YouTube, TikTok | Fraud detection, audience quality analysis, detailed reports | Paid | Larger brands and agencies managing multiple campaigns |
| Native Platform Analytics (e.g., Instagram Insights) | Platform-specific | Basic engagement metrics, reach, impressions | Free | Initial analysis and quick overviews |
| Reach Influencers | Instagram, Youtube, TikTok | Access to micro and nano influencers, campaign management tools | Paid | Businesses wanting easy access to smaller influencers. |
This table highlights the diverse range of tools available, from free basic calculators to comprehensive paid suites. Choosing the right tool depends on your specific needs and budget.
Maximizing Your Investment
Many paid tools offer free trials, providing an excellent opportunity to explore their functionalities before committing to a subscription. Make the most of these trial periods by thoroughly testing key features and assessing their suitability for your workflow. For larger businesses, consider negotiating enterprise packages for customized solutions and potentially more favorable pricing.
By carefully considering these factors – free vs. paid, key features, and exploring available options – you can select an influencer engagement rate calculator that empowers informed decisions, optimizes campaigns, and drives meaningful results. This strategic approach will maximize your return on investment in influencer marketing.
Turning Raw Metrics into Actionable Intelligence
Numbers without context don’t tell the whole story. They’re just vanity metrics. An influencer engagement rate calculator provides that crucial context, transforming raw data into strategic insights. This allows you to move beyond simply measuring engagement and begin actively managing and improving it, leading to more effective, data-driven campaign decisions.
Identifying Engagement Patterns and Content Themes
Analyzing engagement data over time reveals valuable patterns. You can pinpoint peaks and valleys in engagement and correlate them with specific content themes, posting times, or even external events. For example, a beauty influencer might notice a spike in engagement on posts featuring sustainable products. This could indicate a growing interest in eco-conscious beauty among their audience. Recognizing these patterns empowers you to create more of the content that resonates and less of what falls flat, leading to continuous optimization and long-term success in influencer marketing.
Spotting Artificial Engagement
One of the most valuable applications of an influencer engagement rate calculator is its ability to help identify artificial engagement. Sudden, unnatural spikes in engagement, combined with low-quality or generic comments, can be red flags for bot activity or participation in engagement pods. This ability to differentiate authentic engagement from manufactured hype protects your brand from investing in partnerships that deliver superficial results. It ensures you focus on genuine influence, not inflated numbers.
Evaluating Engagement Quality
Beyond the raw numbers, analyzing the quality of engagement is crucial. This involves assessing comment sentiment, audience relevance, and genuine brand affinity. For example, a large number of comments asking unrelated questions or expressing negative sentiment can indicate a disconnect between the influencer and the brand message. Conversely, comments demonstrating genuine interest in the product or brand suggest a strong alignment and higher potential for conversion. Learn more in our article about mastering influencer outreach and relationship building.
Correlating Engagement with Business Outcomes
To truly demonstrate the value of influencer marketing, you need to connect engagement metrics with tangible business outcomes. This means correlating engagement data with conversion rates, click-through performance, and shifts in brand perception. This holistic view of influencer impact allows you to understand which campaigns are truly driving results and empowers you to adjust your strategy based on data, maximizing return on investment (ROI). For instance, if an influencer’s posts consistently generate high engagement but low click-through rates, it might indicate a disconnect between the content and the call to action. This insight can inform adjustments to future campaigns.
Transforming Engagement into Remarkable Outcomes
Many brands have successfully transformed engagement analysis into remarkable campaign outcomes. By diligently tracking engagement metrics, identifying patterns, and optimizing content strategies, these companies have significantly improved campaign performance and ROI. They’ve moved beyond simply measuring engagement to actively shaping it, building stronger relationships with their target audience through authentic influencer partnerships. This proactive approach has proven to be a key differentiator in the competitive world of influencer marketing.
Building a Feedback Loop That Drives Campaign Success
The most effective brands understand that engagement isn’t just a metric to measure; it’s something to cultivate. They create systems for continuous refinement, ensuring each campaign builds upon the success of the last. This involves establishing a feedback loop, a process of transforming data into actionable insights, promoting collaborative improvement, and optimizing performance over time. Understanding platform engagement is key to driving campaign success. For valuable tips on increasing engagement, check out this resource on increasing social media engagement.
Refining Influencer Selection
An influencer engagement rate calculator can provide valuable data to refine your influencer selection process. Instead of relying solely on follower counts, prioritize genuine audience connection. Seek out influencers whose past performance aligns with your specific campaign goals. For example, if driving website traffic is your objective, focus on influencers with a proven track record of generating clicks. Don’t forget to assess the quality of audience engagement, too. Look for genuine and relevant comments, not generic or spammy interactions. This qualitative analysis is crucial for identifying influencers who can authentically engage your target audience.
Improving Content Briefs
Engagement data can dramatically enhance your content briefs. By understanding what resonates with an influencer’s audience, you can provide more focused and effective guidance. This helps you avoid generic briefs and encourages collaborative creativity. For example, if data shows an influencer’s audience responds well to video content, incorporate that format into your campaign strategy. This tailored approach ensures content aligns with audience preferences, maximizing the chances of success.
Establishing Performance Benchmarks
Clear performance benchmarks are essential for evaluating campaign effectiveness. This involves setting realistic expectations based on industry standards and previous campaign data. An influencer engagement rate calculator is invaluable for defining these benchmarks, providing a tangible measure of success. If the average engagement rate for your industry is 3%, for instance, use that as your baseline target. This establishes a measurable goal and allows for data-driven adjustments throughout the campaign lifecycle.
Setting Up Content Experiments
A dynamic feedback loop requires continuous experimentation. Test different content formats, posting times, and call-to-actions. Track the engagement metrics for each experiment to pinpoint the most effective strategies for your target audience. This data-driven approach optimizes your content strategy over time. If you’re unsure whether carousel posts or Reels perform better, conduct a test and analyze the results.
Communicating Engagement Insights
Sharing engagement insights with stakeholders and influencer partners is essential for collaborative improvement. This creates transparency and fosters a data-driven environment where everyone works towards shared goals. Regularly distribute reports highlighting key performance indicators (KPIs) and actionable recommendations. This collaborative approach maximizes the effectiveness of your influencer marketing campaigns. Providing influencers with access to engagement data empowers them to optimize their content, strengthening your partnership and driving better results.
Boost your influencer marketing ROI with REACH Influencers! Our platform connects brands with motivated micro and nano influencers, helping you launch targeted campaigns that resonate with your audience. Visit REACH Influencers today to learn more and get started.


