
A social media analytics dashboard is your command center. It pulls all your data from different social platforms into one single, clean view. This means no more bouncing between native analytics on Facebook, Instagram, and LinkedIn to piece together the full story. Instead, you get a unified space that turns raw numbers into insights you can actually use.
Why Your Social Media Analytics Dashboard Matters
Imagine trying to fly a plane by running around the cockpit to check dozens of separate dials and gauges. It would be chaotic, and you'd definitely miss something important. That's what managing social media without a dashboard feels like.
A good dashboard brings all that critical information—your performance on Instagram, Facebook, LinkedIn, and elsewhere—into one place. It organizes the chaos of likes, shares, and comments into clear business intelligence. So, instead of just seeing a post got 500 likes, you can immediately understand how that post drove website traffic, which specific audience segment it resonated with, and how it stacked up against your competitor’s content that same day.
Uncovering the Story Behind the Numbers
It's easy to get caught up in scorekeeping, just counting likes and followers. But those are just surface-level numbers. A dashboard helps you dig deeper to understand the why behind your performance, connecting the dots to reveal real audience behaviors and content trends.
For instance, you might notice that your video posts get fewer likes than your flashy graphics. But by looking at the whole picture in your dashboard, you could discover those same videos generate three times more shares and drive twice the click-throughs to your product pages. That’s a game-changing insight you’d completely miss if you were just looking at isolated stats within each app.
This is where you start answering the questions that truly matter:
- Audience Behavior: What topics are actually getting my followers to talk and engage?
- Content Performance: Which formats are doing the heavy lifting to drive traffic and leads?
- Campaign Impact: Did our last campaign just create noise, or did it genuinely improve how people feel about our brand?
Proving ROI and Justifying Your Strategy
Ask any social media manager what their biggest headache is, and many will say "proving ROI." A social media analytics dashboard is the best tool for the job. It helps translate fuzzy engagement metrics into hard business outcomes like conversions, leads, and customer sentiment. You can finally draw a straight line from your team's activity to the company's bottom line.
A dashboard gives you the concrete evidence to show stakeholders that social media isn't just a fluffy add-on—it’s a powerful engine for business growth. The conversation shifts from, "How many followers did we gain?" to, "How much revenue did our last campaign generate?"
Being able to demonstrate this value is more critical than ever. The demand for solid analytics is exploding, with the global social media analytics market expected to jump from USD 10.23 billion in 2024 to USD 43.25 billion by 2030. As you can see from the market growth projections on Grandviewresearch.com, businesses are leaning heavily on data to get ahead. A dashboard is what empowers you to stop guessing and start making strategic decisions that deliver real, measurable results.
Decoding the Metrics That Actually Drive Growth
Opening up a social media analytics dashboard can feel like staring at a plane's cockpit—a dizzying array of charts, numbers, and percentages. But buried in all that data is the real story of your brand's performance. The trick isn't to track everything, but to know which numbers truly matter and what they’re trying to tell you.
Instead of getting lost in the weeds, let's focus on four key pillars that build on each other. This approach helps paint a complete, understandable picture of your growth.
This graphic really helps visualize how these metrics form a hierarchy, starting from basic awareness and building all the way up to your core business goals.
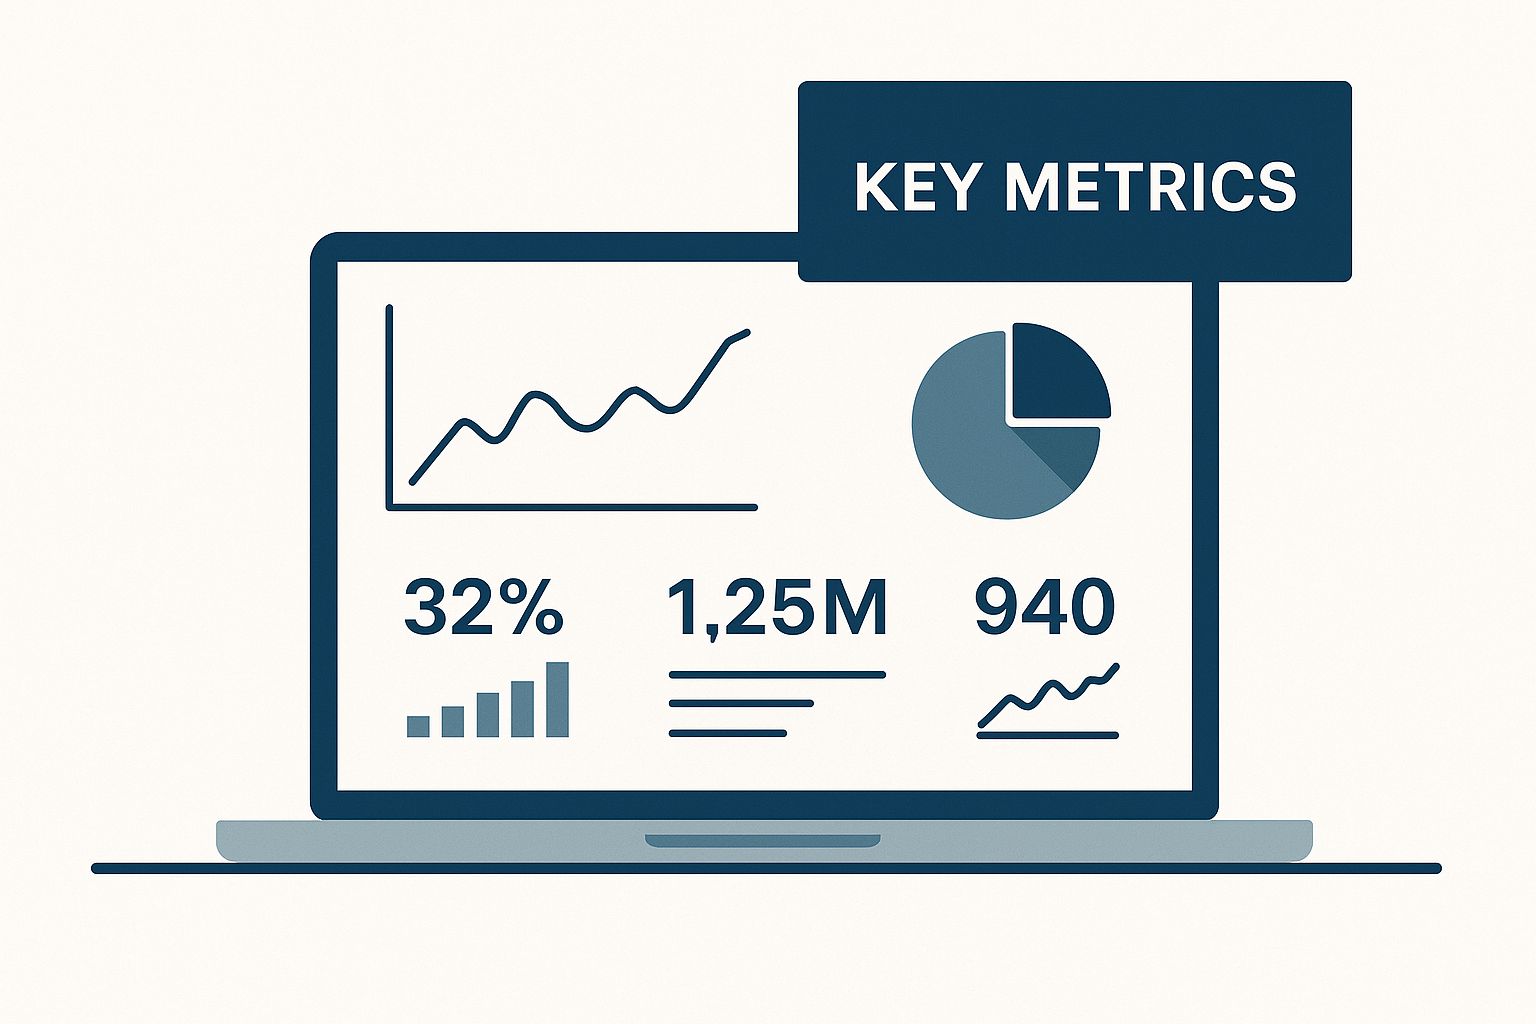
When you set up your dashboard this way, you can instantly see how top-of-funnel activities translate into bottom-line results.
Awareness: The Foundation of Visibility
Before anyone can engage with your content or buy your product, they have to know you exist. It’s that simple. Awareness metrics tell you how big of an audience you’re actually reaching. They are the absolute foundation of your strategy—if no one sees you, nothing else you do matters.
Think of it like a storefront on a busy street. The more people who walk past and glance inside, the higher your chances of attracting a customer.
Two core metrics define this pillar:
- Reach: This is the total number of unique users who saw your content. It answers the simple question, "How many individual people did we connect with?"
- Impressions: This is the total number of times your content was displayed, whether it was clicked or not. If one person sees your post three times, that’s three impressions but only one in reach.
A high impression count with low reach can be a red flag. It might mean your content is being shown to the same small group over and over, which can lead to ad fatigue. Keeping an eye on both gives you a much clearer sense of your true audience size.
Engagement: The Heartbeat of Your Community
Okay, so people see your content. The next big question is: do they care? Engagement metrics measure how your audience is interacting with what you post. This is the heartbeat of your community, showing you what content truly resonates and sparks a genuine connection.
High engagement is a fantastic sign. It means you're not just shouting into the void; you're actually building relationships.
Strong engagement is a direct indicator of content health. It tells you that your message is relevant, your timing is right, and your audience feels connected enough to take action, even if it's just a simple 'like'.
Key engagement metrics include:
- Likes, Comments, and Shares: These are the most obvious forms of interaction. A share is especially valuable because it’s your audience doing the marketing for you, expanding your reach organically.
- Engagement Rate: This metric gives raw numbers some much-needed context. By calculating the percentage of your audience that interacted with a post—often as (Total Engagements / Total Reach) x 100—you can compare performance across posts of different sizes.
- Click-Through Rate (CTR): This measures how many people who saw your post actually clicked on a link within it. It’s a crucial bridge that leads people from simply engaging to taking a more significant action.
Understanding what makes these metrics tick is key to a healthy social presence. The table below breaks down the most important metrics you'll find on a dashboard, what they really mean, and what business questions they help you answer.
Essential Social Media Metrics and Their Business Meaning
| Metric Category | Key Metrics | What It Tells You | Strategic Question It Answers |
|---|---|---|---|
| Awareness | Reach, Impressions | The size of your potential audience and the frequency they see your content. | "How many people are we reaching, and are we visible enough?" |
| Engagement | Likes, Comments, Shares, Engagement Rate | How compelling and relevant your content is to your audience. | "Is our content resonating, or are we just making noise?" |
| Conversion | Click-Through Rate (CTR), Conversion Rate, Leads | How effectively your social media drives desired business actions. | "Are our social efforts actually generating leads and sales?" |
| Advocacy | Brand Mentions, Sentiment Score, Reviews | The level of customer loyalty and satisfaction you've built. | "Do our customers love us enough to become our champions?" |
By focusing on these specific areas, you can cut through the noise and get straight to the insights that will help you make smarter, more effective decisions for your brand.
Conversion: The Impact on Your Business Goals
Awareness and engagement are great, but they need to lead somewhere. Conversion metrics are where the rubber meets the road, tracking how well your social media efforts are turning followers into customers, leads, or subscribers. This is how your dashboard directly connects social activity to real business outcomes.
For example, tracking which posts drive the most demo sign-ups tells you exactly which content is fueling your sales pipeline. This data is gold—it allows you to prove ROI and make much smarter decisions about where to invest your time and budget. It's crucial to understand the full spectrum of digital marketing performance metrics to see how social conversions fit into the bigger picture.
Advocacy: The Voice of Your Customers
The final, and arguably most powerful, pillar is advocacy. These metrics measure how your happy customers become a marketing force of their own. Advocacy is about nurturing your audience into a loyal community that actively and enthusiastically promotes your brand for you.
At this stage, your job is mostly to listen.
- Brand Mentions: Keep track of how often people are talking about your brand, even when they don't bother to tag your official account.
- Sentiment Analysis: Go beyond just counting mentions to understand how people feel. A good social media dashboard can categorize mentions as positive, negative, or neutral. A 90% positive sentiment score is a powerful testament to brand health.
- Customer Reviews and Testimonials: Monitor and amplify positive user-generated content. When a customer leaves a glowing review, it’s often more persuasive and trustworthy than any ad you could ever run.
By organizing your dashboard around these four pillars—Awareness, Engagement, Conversion, and Advocacy— you create a logical story. It’s a clear path from initial visibility to lasting loyalty, turning complex data into a simple roadmap for growth.
How to Choose the Right Analytics Dashboard
Picking the right social media analytics dashboard can feel a lot like trying to find the perfect key for a complicated lock. There are so many options out there, and they all promise deeper insights and better results. It's easy to get paralyzed by the choice.
But here’s the secret: the goal isn't to find the tool with the longest list of features. It's about finding the one that lines up perfectly with what you’re actually trying to accomplish.
Think of it like this. A Formula 1 driver needs a dashboard that screams real-time performance data—speed, RPMs, tire pressure. A long-haul trucker needs a dashboard focused on efficiency and endurance. Your business is no different. The right dashboard delivers the specific intelligence you need to win your race.
Step 1: Start with Your Strategic Goals
Before you even glance at a single product page, you have to get clear on what success looks like. Are you chasing sales leads? Trying to build a loyal community? Or is driving traffic to your website the top priority? Your main objective is the filter for everything else.
Start by asking a few hard questions:
- What is our main social media goal? Is it lead generation, brand awareness, community engagement, or direct sales?
- Who needs to see this data? Is this for the marketing team's daily huddles or for the C-suite's quarterly review? The audience dictates the level of detail needed.
- What decisions will this data inform? Are you trying to justify ad spend, tweak your content calendar, or just keep an eye on your brand's reputation?
Answering these questions first gives you a roadmap. It stops you from getting distracted by flashy features that don’t actually help your bottom line, ensuring you pick a tool that truly works for you.
Step 2: Identify Non-Negotiable Features
Once you know your goals, you can build a checklist of must-haves. Every business is unique, of course, but there are some foundational capabilities that any serious dashboard needs to have. Think of these as the table stakes—the core functions you simply can't operate without.
Your checklist should absolutely include:
- Multi-Platform Integration: The tool has to connect seamlessly with every social network where you have a presence. No exceptions.
- Customizable Reporting: You need the power to build reports that show what your stakeholders care about, not just some generic, one-size-fits-all template.
- Competitor Tracking: Knowing how you’re doing is only half the picture. You have to see how you measure up against the competition to get the full story.
These core features are the backbone of any dashboard worth its salt. And when you're thinking about platform-specific insights, diving into resources like a guide to YouTube Channel Analytics can give you invaluable depth on a key channel.
Step 3: Evaluate Advanced Capabilities and Budget
With the basics covered, now you can look at the advanced features—the stuff that gives you a real competitive edge. This is where you see the big differences between tools, often with sophisticated tech baked in to pull out deeper insights.
You might want to consider functionalities like:
- AI-Powered Sentiment Analysis: This automatically figures out if people are talking about your brand in a positive, negative, or neutral way.
- Influencer Identification: A huge time-saver for finding and tracking the key voices in your industry.
- Predictive Analytics: This uses your historical data to forecast future trends or see how a campaign might perform.
Finally, you have to square all this with your budget and team size. A solo entrepreneur has completely different needs (and resources) than a massive enterprise. Be honest about what you can afford and, just as important, what your team has the bandwidth to actually use well.
The best social media analytics dashboard isn't the most expensive or the most complex. It's the one that becomes an intuitive, indispensable part of your team's daily workflow, turning data into decisive action with minimal friction.
Setting Up Your Dashboard for Actionable Insights
Think of a brand new social media analytics dashboard like a powerful sports car sitting in the garage. It's packed with potential, but it isn't going anywhere just yet. The real magic happens when you customize it to fit your specific goals, turning it from a messy pile of data into an intelligent tool that works for you.
The initial setup is your foundation. This isn't just about connecting your accounts; it’s about thoughtfully designing a system that flags opportunities and warns you about problems as they happen. The whole point is to build a dashboard that lets you spend less time digging for numbers and more time making smart decisions.
Connecting Your Accounts and Defining Your KPIs
First things first, you need to securely connect all your social media profiles. Any good platform will walk you through this with a simple, secure process and start pulling in your past data so you can get a running start. With your accounts linked, the most important task is next: defining your Key Performance Indicators (KPIs).
Your KPIs are the few crucial metrics that tell you if you're actually hitting your business goals. For example, if you’re trying to build brand awareness, you’ll want to watch Reach and Share of Voice. But if lead generation is your game, you should be laser-focused on Click-Through Rate (CTR) and Conversion Rate.
The biggest mistake people make is tracking everything. Pick three to five core KPIs that tell you, at a glance, whether you’re winning or losing. This focus is what turns a data overload into clear, simple direction.
Customizing Reports for Different Stakeholders
Let's be honest: your CEO doesn't care about the same numbers your social media manager does. While your team needs to see post-by-post performance, leadership just wants a high-level summary that ties social media back to revenue. A flexible dashboard lets you build and save different report views for different people.
You could create tailored reports for:
- The Marketing Team: A detailed breakdown of campaign metrics, audience engagement, and what content is hitting the mark.
- The Sales Team: A report that zeroes in on leads, conversion rates from social, and any insights that help them sell.
- Executive Leadership: A clean, visual summary of the big picture—ROI, customer sentiment, and where you stand against competitors.
To make these reports really land, you need to follow solid data visualization best practices. Good visuals turn complicated data into a story that anyone can understand and get behind.
Establishing Benchmarks and Automated Alerts
So, you got a 2% engagement rate. Is that good? Bad? Without any context, a metric is just a number. That’s why you absolutely have to set performance benchmarks. Look at your past data to figure out what’s “normal” for you. This baseline makes it instantly obvious when a piece of content is a huge hit or a total flop.
This is also where automated alerts become your secret weapon. You can set up your dashboard to send you a notification for specific events, like:
- A sudden, unexplained drop in engagement.
- A spike in negative comments about your brand.
- A competitor’s post that’s suddenly going viral.
These alerts shift your dashboard from a reactive tool to a proactive one. They give you a heads-up so you can jump on opportunities or put out fires before they get out of control. To really get this right, you have to know what makes people tick, so be sure to read our complete guide on how to measure social media engagement.
Turning Dashboard Data Into a Winning Strategy
A social media analytics dashboard is so much more than a place to glance at numbers—it’s your command center, the launchpad for your next big move. Raw data on its own is just noise. It only becomes valuable when you use it to make a smart decision. This is where you connect the dots between analysis and action, turning those insights into a real-world strategy that builds your brand and smashes your business goals.
Think of your dashboard as a treasure map. The metrics are clues pointing you toward hidden opportunities, but you still have to follow the trail and do the digging. It’s about shifting from passively watching numbers go up or down to actively asking, "What is this telling me, and how can I use it to make my next move better?"

From Engagement Data to a Resonant Content Calendar
One of the quickest ways to put your data to work is by fine-tuning your content calendar. Your dashboard shows you exactly which topics, formats, and posting times are getting people talking. Don't let that goldmine of information sit there.
Let's say your dashboard reveals that short, snappy video tutorials posted on weekday mornings consistently get the highest engagement. That's not just a nice-to-know—it's a bright, flashing signal from your audience. The strategic move? Double down on that format. Schedule more tutorials during that peak window. This is how you stop guessing and start giving your audience exactly what they’re asking for. You can get even more granular by exploring a full range of social media engagement metrics.
Leveraging Demographics to Optimize Ad Spend
Your dashboard's demographic data is your secret weapon for making every ad dollar count. It lays out the age, location, gender, and interests of the people who already love your organic content. So why would you spend money targeting anyone else?
For instance, if your analytics show that 70% of your most engaged followers are women aged 25-34 living in major cities, you can build laser-focused ad campaigns aimed squarely at that group. This approach takes the guesswork out of your ad spend, making sure your budget reaches the people most likely to convert instead of being sprayed across a broad, uninterested audience.
By aligning your paid strategy with your organic audience insights, you transform your advertising from a shot in the dark into a precision-guided missile aimed directly at your ideal customer.
This is exactly why the social media analytics market is exploding. Valued at around USD 14.0 billion in 2024, it’s projected to skyrocket to USD 83.11 billion by 2033. That growth is all about businesses using data to create more personal experiences and prove their campaigns are actually working.
The Analyze, Act, Measure, Repeat Feedback Loop
To really bake data-driven decisions into your everyday workflow, you need a simple but powerful system. A continuous improvement cycle ensures you’re always learning and adjusting your strategy based on what's happening in the real world.
Think of it as a four-stage feedback loop:
- Analyze: Dive into your dashboard and find one key insight. Maybe it’s a top-performing post, a surprising demographic trend, or a competitor's obvious blind spot.
- Act: Based on that insight, create a specific, testable action. For example, if you notice your competitors go silent on weekends, your action could be to test out dedicated weekend community management.
- Measure: Head back to your dashboard to track the results. Did your weekend engagement spike? Did positive sentiment climb?
- Repeat: Looking at the results, you either scale up what worked or go back to the drawing board with a new idea. Then the cycle starts all over again.
This iterative process turns your social media plan from something static and rigid into a living, breathing system that constantly adapts to your audience. When combined with other online reputation management tools, this cycle of action and measurement helps you build a winning strategy that delivers consistent, predictable growth.
Common Questions About Analytics Dashboards
Even with the best social media analytics dashboard at your fingertips, questions are bound to come up. Figuring out the finer points of how and when to use your tool is what separates surface-level reporting from truly unlocking its power. Let’s tackle some of the most common questions to help you sharpen your strategy and trust your data.
When you get these answers right, your dashboard stops being just a reporting tool and becomes a strategic partner in your daily decisions.
How Often Should I Check My Dashboard?
There's no magic number here. How often you peek at your dashboard really depends on what you're trying to accomplish. Forget a one-size-fits-all schedule; your check-ins should match your goals.
- Daily Check-In (15 minutes): This is your morning coffee check-in, perfect for community management and taking the pulse of your brand's health. You're looking for big spikes in mentions, seeing how that new post is doing in real-time, and catching any urgent customer comments.
- Weekly Deep-Dive (1 hour): Set aside a dedicated hour for this. Here, you'll dig into the past week's performance, pinpointing your best content and seeing how campaigns are tracking against your KPIs. This is where you make smart tweaks to your content plan for the week ahead.
- Monthly Review (2-3 hours): This is the big picture meeting, either with yourself or your stakeholders. You'll analyze long-term trends, calculate your overall ROI, and see how you stack up against the competition. These insights shape your strategy for the entire next month.
Can a Dashboard Truly Measure ROI?
Yes, it absolutely can. A properly set up social media analytics dashboard is one of the clearest ways to measure your Return on Investment (ROI). It’s the tool that finally connects the dots between your social media hustle and real business results.
The secret lies in tracking conversions. By using things like UTM parameters in your links, you can follow a user's journey from a click on your Instagram post directly to a sale or a sign-up on your website.
By putting a dollar value on each of those conversions and stacking it up against what you spent—on ads, tools, and even your team's time—your dashboard can spit out a clear, defensible ROI. This is how you prove your work is making the company money.
What Is Social Listening Versus Social Analytics?
People often use these terms interchangeably, but they're two sides of the same coin. Knowing the difference is key to building a complete strategy.
Social media analytics is all about looking in the mirror. It’s focused on the data from your own accounts—your Instagram, your TikTok, your LinkedIn. You’re analyzing your past performance by tracking metrics like reach, engagement, and follower growth to see what’s working for you.
Social listening, on the other hand, is about looking out the window. It's a much broader view, where you track keywords, brand mentions, and conversations across the entire social media landscape, not just on your own turf. It’s how you find out what people really think about your brand, your competitors, and your industry as a whole.
Ready to transform your data into a winning strategy? REACH provides the advanced analytics and influencer discovery tools you need to prove your impact and drive measurable growth. See how our platform can supercharge your campaigns by visiting our official website.
