

Unlocking Social Media Success in 2025
Want to maximize your social media impact? This listicle reveals eight essential social media engagement metrics you need to track in 2025. Learn how to interpret metrics like engagement rate, reach, click-through rate (CTR), shares, comments, conversions, follower growth, and video completion rate. Understanding these key social media engagement metrics empowers you to refine your content strategy, boost brand visibility, and achieve your business goals. Let’s dive in.
1. Engagement Rate
Engagement rate is a crucial social media engagement metric that measures the level of interaction your content receives relative to your audience size. It provides a standardized way to gauge how well your content resonates with your followers and offers valuable insights into your social media performance. It’s calculated by dividing the total number of engagements (likes, comments, shares, saves, etc.) on a post by your total number of followers, then multiplying by 100 to express it as a percentage. This normalization based on audience size allows for meaningful comparisons between accounts with varying follower counts, making it a more insightful metric than raw engagement numbers alone.
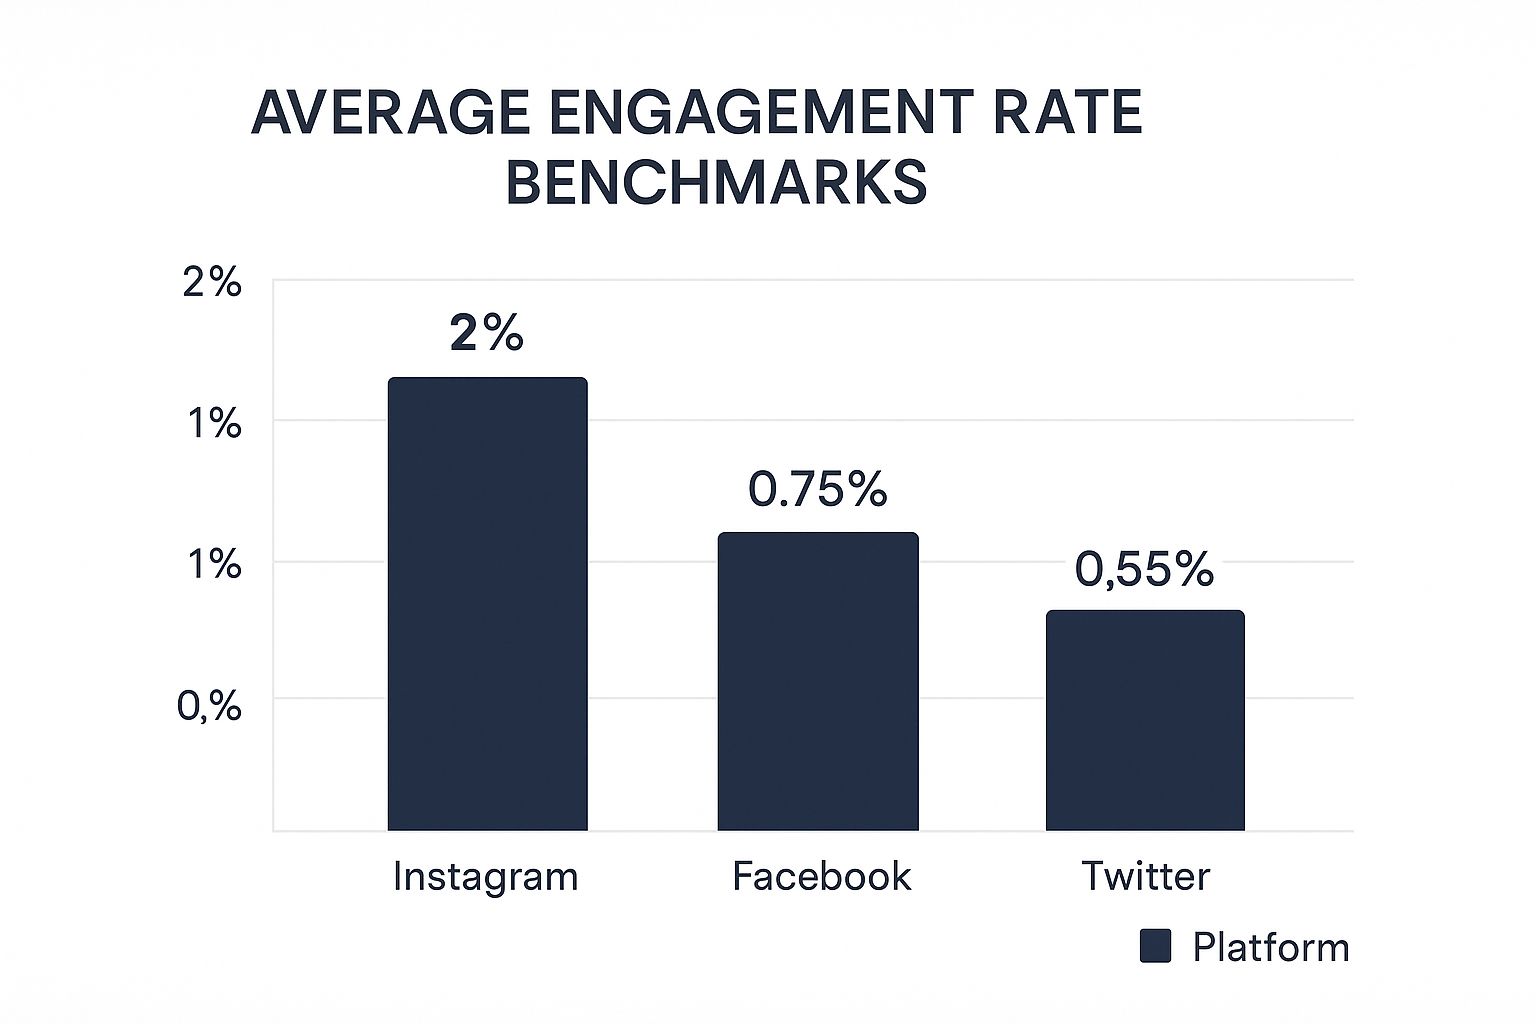
The infographic above illustrates how engagement rate is calculated and why it’s important. It visually breaks down the formula and highlights its significance in understanding audience interaction. As shown, a higher engagement rate generally indicates stronger content performance and audience connection.
While the basic formula focuses on followers, variations exist. You can calculate engagement rate by reach or impressions for a more nuanced understanding of audience resonance. For example, engagement rate by reach considers the number of unique users who saw your content, providing a potentially more accurate reflection of how engaging your content is for the audience it actually reached. Want to dive deeper into understanding and tracking these metrics? The Essential Social Media Engagement Metrics Guide from OKZest provides a comprehensive overview.
Features and Benefits:
- Normalizes for Audience Size: Allows for fair comparison across different account sizes.
- Time Period Flexibility: Can be calculated per post, daily, weekly, monthly, etc., enabling trend analysis.
- Content Performance Indicator: Helps identify high-performing content types and topics.
- Competitive Benchmarking: Facilitates comparison against competitors to understand industry standards.
Pros:
- Standardized comparison across accounts.
- Identifies engaging content types.
- More meaningful than raw engagement.
- Useful for competitive analysis.
Cons:
- Industry benchmarks vary widely.
- Doesn’t measure engagement quality.
- Susceptible to artificial inflation.
- Platform-specific calculation differences.
Examples of Successful Implementation:
- Huda Kattan: Maintains a 2-3% engagement rate despite millions of followers, showcasing consistent audience connection.
- GoPro: Achieves high engagement rates with user-generated action content, demonstrating the power of community involvement.
- Red Bull: Consistently sees 3-5% engagement rates on Instagram with extreme sports content, proving the effectiveness of targeted, engaging visuals.
Tips for Utilizing Engagement Rate:
- Calculate engagement rate by reach for a more accurate measure of audience resonance.
- Compare your rate against industry benchmarks rather than universal averages.
- Track engagement rate trends over time to identify patterns and optimize content strategy.
- Set realistic engagement rate targets based on platform and industry norms.
This video provides a visual guide to understanding and calculating engagement rate, offering practical tips for improving your social media performance.
Why Engagement Rate Matters:
Engagement rate is a cornerstone of social media engagement metrics because it provides a clear, quantifiable measure of how effectively your content is connecting with your audience. For small and medium enterprises, micro and nano influencers, content creators, marketing professionals, and social media agencies, understanding and optimizing engagement rate is essential for building a strong online presence, fostering community, and achieving social media marketing goals. This metric deserves a top spot on any social media analytics dashboard because it goes beyond vanity metrics like follower count and provides a more nuanced understanding of audience interaction and content performance. By tracking and analyzing your engagement rate, you can refine your content strategy, identify what resonates with your audience, and ultimately achieve greater success on social media.
2. Reach
Reach is a fundamental social media engagement metric that measures the total number of unique users who have seen your content. This metric provides valuable insights into how far your message is spreading across a platform and indicates the size of your potential audience. Unlike impressions, which count multiple views by the same user, reach counts each user only once, regardless of how many times they’ve seen your post. Understanding your reach is crucial for assessing content visibility, potential audience growth, and the overall effectiveness of your social media strategy. It’s a key metric for anyone looking to expand their influence and brand awareness.

Reach can be divided into two categories: organic and paid. Organic reach represents the number of unique users who saw your content without any paid promotion, while paid reach reflects the number of unique users who saw your content as a result of advertising. Both are important to track, as they offer different perspectives on your content’s performance. Reach is directly affected by platform algorithms, which determine what content gets shown to users. Changes to these algorithms can significantly impact your organic reach, making it a dynamic metric that requires ongoing monitoring and adaptation. This metric is readily available on most major social media platforms, including Facebook, Instagram, Twitter, and LinkedIn, making it a universally applicable measure of content visibility.
Features of Reach:
- Measures unique viewers: Focuses on individuals exposed to your content, not just the total view count.
- Organic & Paid: Differentiates between unpaid and paid distribution of your content.
- Algorithm Dependent: Highly susceptible to changes in platform algorithms.
- Widely Available: Accessible on most leading social media platforms.
Pros:
- Accurate Audience Sizing: Provides a realistic picture of the size of your audience.
- Distribution Effectiveness: Helps evaluate how well your content is being distributed.
- Brand Awareness Potential: Indicates your potential to reach new audiences and build brand recognition.
- Foundation for Other Metrics: Serves as a basis for calculating other crucial metrics like conversion rates.
Cons:
- Doesn’t Measure Engagement: Reach tells you how many people saw your content, but not how they interacted with it.
- Algorithm Limitations: Organic reach can be restricted by platform algorithms prioritizing other content.
- Declining Organic Reach: Organic reach is becoming increasingly difficult to achieve on many platforms.
- Paid Promotion Dependence: Often requires paid promotion to significantly expand reach.
Examples of Successful Reach Strategies:
- Oreo’s “Dunk in the Dark” Tweet: During the 2013 Super Bowl blackout, Oreo’s timely and witty tweet achieved massive organic reach, demonstrating the power of real-time marketing.
- National Geographic on Instagram: National Geographic consistently achieves high organic reach by leveraging stunning photography and captivating storytelling.
- Viral Content on TikTok: TikTok’s algorithm facilitates high reach even for new creators, demonstrating the platform’s potential for viral content distribution.
Tips for Maximizing Reach:
- Optimal Posting Times: Schedule posts during peak audience activity hours to reach more users organically.
- Shareable Content: Create high-quality, engaging content that encourages sharing and expands your reach beyond your immediate followers.
- Leverage Platform Features: Utilize platform-specific features like Stories, Reels, and live streams that are favored by current algorithms.
- Analyze and Adapt: Track reach patterns over time to identify optimal posting frequencies and content formats.
Reach’s Significance and Popularization:
Reach’s prominence as a key metric has been influenced by various factors, including the rise of Facebook’s News Feed algorithm which prioritizes certain types of content, digital marketing pioneer Seth Godin’s “permission marketing” concept which emphasizes reaching a receptive audience, and content marketing platforms like Buffer and Later that provide tools for analyzing and optimizing reach. Reach deserves its place on this list of essential social media engagement metrics because it provides a crucial foundational understanding of your content’s visibility and potential impact. For small and medium enterprises, micro and nano influencers, content creators, marketing professionals, and social media agencies, understanding and maximizing reach is essential for achieving business objectives and building a strong online presence.
3. Click-Through Rate (CTR)
Click-Through Rate (CTR) is a crucial social media engagement metric that measures the percentage of people who clicked on a link in your social media content compared to the total number of people who saw it. It’s a direct measure of how effective your content is at driving traffic to an external destination, such as your website, a landing page, or a specific product listing. Calculated by dividing the number of clicks by the number of impressions and multiplying by 100, CTR provides valuable insight into the effectiveness of your calls-to-action and your content’s ability to inspire action.

CTR deserves its place in any social media engagement analysis because it bridges the gap between engagement and conversion. While likes, comments, and shares indicate passive engagement, CTR reveals how many users are taking the desired action – clicking through to learn more or make a purchase. This metric is trackable across various platforms using UTM parameters, allowing for granular analysis of campaign performance. However, it’s important to remember that CTR can vary significantly based on factors like content type, platform, and industry benchmarks.
Features and Benefits:
- Direct indicator of action-taking behavior: CTR moves beyond vanity metrics and reveals how compelling your content truly is.
- Combines engagement and conversion elements: It indicates interest and the likelihood of conversion.
- Trackable across platforms: UTM parameters enable accurate measurement of campaign effectiveness.
- Critical for evaluating lead generation: CTR directly impacts the number of potential leads generated from social media.
- Helps assess call-to-action effectiveness: A low CTR may indicate a weak call-to-action.
Pros:
- Measures actual interest beyond passive engagement.
- Directly ties social media efforts to website traffic.
- Critical for evaluating lead generation effectiveness.
- Helps assess call-to-action effectiveness.
Cons:
- Can be affected by technical issues like slow loading times.
- Link placement and visibility significantly impact results.
- Often lower than other engagement metrics.
- Requires proper tracking setup to measure accurately.
Examples of Successful Implementation:
- BuzzFeed: Utilizes curiosity-gap headlines (e.g., “10 Things You Won’t Believe About…”) to achieve high CTRs.
- The New York Times: Effectively uses Twitter to drive traffic with compelling snippet quotes linked to full articles.
- Sephora: Achieves strong CTRs by featuring limited-time offers and exclusive product previews in Instagram Stories.
Tips for Improving CTR:
- Use clear, action-oriented language in calls-to-action: Tell your audience exactly what you want them to do (e.g., “Shop Now,” “Learn More,” “Download the Guide”).
- Create urgency with limited-time offers and promotions: Encourage immediate action by highlighting scarcity.
- A/B test different link texts and placements: Experiment to find what resonates best with your audience.
- Ensure destination pages deliver on the content promise: A disconnect between your social media content and the linked page can lead to high bounce rates.
- Use URL shorteners with tracking capabilities: Tools like Bitly allow you to track clicks and analyze performance.
When and Why to Use CTR Analysis:
CTR analysis is valuable for anyone running social media campaigns aimed at driving traffic to external resources. For small and medium enterprises, micro and nano influencers, content creators, marketing professionals, and social media agencies, CTR is a key performance indicator (KPI) for evaluating campaign ROI and optimizing content strategies. Regularly monitoring and analyzing CTR can help you understand what resonates with your audience, improve your calls to action, and ultimately drive more valuable traffic to your desired destinations. Understanding its nuances, alongside other social media engagement metrics, allows for a comprehensive understanding of audience behavior and campaign effectiveness.
4. Shares/Retweets/Reposts
Shares, retweets, and reposts—collectively referred to as “shares” in this section for simplicity—represent one of the most potent social media engagement metrics. This metric tracks how often your audience shares your content within their own networks on various platforms, using the platform-specific terminology (shares on Facebook, retweets on Twitter, reposts on Instagram, etc.). Tracking shares is crucial for understanding content effectiveness and overall social media strategy because it provides valuable insights into what resonates with your audience and fuels organic reach. This metric deserves its place on the list of essential social media engagement metrics due to its significant impact on brand visibility and potential for exponential growth.
How Shares Work and Why They Matter
Sharing goes beyond simply liking or commenting on a post. It signifies a conscious decision by a user to actively endorse your content and broadcast it to their connections. This implicit endorsement carries considerable weight, as it leverages the trust and influence users have within their own networks. A share effectively introduces your brand and your message to a new audience segment, expanding your reach far beyond your immediate followers. Furthermore, shares generate second-generation engagement opportunities. When someone in a user’s network interacts with the shared content, it further amplifies the message and creates a ripple effect of engagement.
Features and Benefits of Tracking Shares:
- Extends Content Visibility: Shares propel your content beyond your existing follower base, reaching new potential followers and significantly expanding organic reach.
- Implicit Endorsement: Sharing carries a powerful implicit endorsement from the sharer, lending credibility to your content and brand.
- Creates Second-Generation Engagement: Shared content generates opportunities for further engagement from the sharer’s network, creating a ripple effect.
- Platform-Specific Terminology: Understanding the platform-specific terms (shares, retweets, reposts) allows for accurate tracking and analysis.
Pros:
- Significantly Expands Organic Reach: Sharing is a powerful driver of organic reach, exposing your content to a wider audience without paid advertising.
- Indicates High-Value Content: High share counts signal that your content resonates deeply with your audience and is perceived as valuable.
- Introduces Your Brand to New Potential Followers: Each share exposes your brand to a new network of potential followers, increasing brand awareness and reach.
- Algorithm Boost: Most social media algorithms prioritize content with high share counts, leading to increased visibility in feeds and search results.
Cons:
- Harder to Achieve Than Likes or Comments: Earning shares typically requires more compelling and share-worthy content than simply eliciting likes or comments.
- Difficult to Prompt Directly: While you can encourage sharing, explicitly asking for it can sometimes feel forced and be less effective.
- Potential for Negative Sharing: While less common, content can be shared to criticize or ridicule, potentially creating negative publicity.
- Platform Variability: Sharing behavior varies significantly across platforms and audiences, making direct comparisons difficult.
Examples of Successful Implementation:
- Wendy’s: Their witty and sarcastic Twitter responses frequently generate thousands of retweets, demonstrating the power of humor and engagement.
- Spotify: The annual “Wrapped” campaign, showcasing users’ listening statistics, is explicitly designed for sharing, resulting in millions of story shares across platforms.
- The Ice Bucket Challenge: This viral phenomenon generated over 17 million shares during its peak, highlighting the potential for social media campaigns to achieve massive reach through shares.
Actionable Tips for Increasing Shares:
- Evoke Emotions: Create content that triggers strong emotional responses, such as awe, amusement, inspiration, or empathy.
- Visual Appeal: Incorporate visually appealing elements like high-quality images, videos, and infographics.
- Tap into Trending Topics: Engage with timely topics and trending conversations to increase relevance and shareability.
- Strategic Calls to Action: Occasionally and strategically ask followers to share valuable resources or content that aligns with their interests.
- Shareable Formats: Design content in easily shareable formats, such as infographics, quotes, and short videos.
When and Why to Use This Approach:
Tracking shares should be a continuous process. Analyzing share data helps you understand what type of content resonates best with your audience. This informs your content strategy, allowing you to create more of the content that drives shares and expands your reach. For small businesses, influencers, and content creators, focusing on shareable content is essential for organic growth and building a strong online presence. Marketing professionals and social media agencies can use share data to measure campaign effectiveness and refine their strategies.
Influential Figures and Concepts:
- Twitter’s Retweet Feature: The retweet feature became a cultural phenomenon, popularizing the concept of sharing on social media.
- Jay Baer & “Talk Triggers”: Social media strategist Jay Baer coined the term “talk triggers” to describe memorable and shareable customer experiences that drive word-of-mouth marketing, including online sharing.
- Viral Content Creators: Platforms like BuzzFeed and Upworthy mastered the art of creating highly shareable viral content, demonstrating the power of emotion and storytelling.
5. Comments and Replies
Comments and replies are crucial social media engagement metrics that measure the number of written responses users leave on your content. Unlike passive engagements like likes, comments represent a more active and invested audience, signifying deeper resonance with your brand and message. This metric is highly valued because it indicates a willingness to engage in conversation, share opinions, and interact with both your brand and other community members. Tracking comments and replies provides valuable insights into audience sentiment, content effectiveness, and overall community health.
How Comments and Replies Work:
This metric quantifies the direct responses users provide to your posts. It’s not just about the sheer number of comments but also their quality and sentiment. Analyzing the content of comments helps you understand what resonates with your audience, identify potential issues or concerns, and gather valuable user-generated content and insights.
Why Comments and Replies Deserve a Place on the List:
In the crowded landscape of social media engagement metrics, comments and replies stand out as a key indicator of genuine interaction and community building. They move beyond superficial engagement and represent a deeper level of connection with your audience. This metric is particularly important for brands and individuals looking to foster a loyal following and build meaningful relationships online.
Features and Benefits:
- Indicates active engagement: Comments represent a conscious decision to interact, offering a more accurate measure of genuine interest compared to passive actions like likes.
- Community-building and relationship development: Comments create opportunities for two-way communication, fostering a sense of community among your followers and strengthening brand-customer relationships.
- Source of user-generated content and insights: Comments provide direct feedback, valuable insights into audience preferences, and potential user-generated content that can be leveraged for future campaigns.
- Algorithm boost: Platforms like Facebook prioritize content that generates “meaningful interactions,” which includes comments and replies, leading to increased organic reach.
Pros:
- Direct feedback and audience insights: Gain valuable understanding of audience sentiment and preferences directly from their comments.
- Meaningful brand-customer interactions: Create opportunities for personalized engagement and build stronger relationships with your audience.
- Boosts content visibility: Increased comments can positively impact your content’s performance in platform algorithms.
- Community building: Foster a sense of belonging and encourage interaction amongst your followers.
Cons:
- Moderation and response management: Requires active monitoring and dedicated resources to manage comments effectively.
- Negative feedback and spam: Be prepared to address negative comments and filter out spam or irrelevant content.
- Time-consuming: Properly managing and responding to comments can be a significant time investment.
- Variable comment quality: Not all comments are created equal; some may be low-effort or lack substance.
Examples of Successful Implementation:
- Glossier: Actively encourages and responds to product feedback in the comments section, driving high engagement and fostering a sense of community around their brand.
- National Geographic: Generates thousands of comments by posing thought-provoking questions related to their visually stunning posts, sparking discussions and encouraging knowledge sharing.
- Airbnb: Uses travel story prompts to encourage high comment volumes on their Instagram posts, building a community around shared travel experiences.
Actionable Tips:
- Ask open-ended questions: Stimulate conversation by asking questions that encourage thoughtful responses.
- Respond promptly: Show your audience you value their input by replying to comments in a timely manner.
- Create content that elicits opinions and personal experiences: Encourage sharing and discussion by posting relatable content.
- Develop a comment moderation policy: Establish clear guidelines for acceptable behavior and address negative comments constructively.
- Acknowledge both positive and constructive negative feedback: Show appreciation for positive comments and address negative feedback professionally.
Popularized By:
- Instagram’s comment threading feature, which enhanced conversations and made it easier to follow individual threads.
- Community management expert Richard Millington, who advocates for building meaningful online interactions.
- Facebook’s 2018 algorithm update, which prioritized “meaningful interactions” including comments and replies, boosting the importance of this metric.
6. Conversion Rate: Turning Engagement into Tangible Results
Conversion rate is arguably the most crucial social media engagement metric for businesses and content creators alike. It moves beyond vanity metrics like likes and shares, focusing instead on the percentage of users who complete a desired action after engaging with your social content. This action could be anything from signing up for your newsletter and downloading a resource to making a purchase or filling out a lead generation form. In essence, conversion rate measures how effectively your social media activities are translating into tangible business outcomes. This is why it deserves a prominent place in any list of essential social media engagement metrics.
Conversion rate is calculated by dividing the number of conversions by the total number of visitors from social media and multiplying by 100. For example, if 100 people click a link from your Instagram post to your website, and 5 of them make a purchase, your conversion rate for that post is 5%.
Why is Conversion Rate Important?
This metric directly ties social media efforts to business objectives. It demonstrates the actual value derived from your social media presence. Are your captivating posts actually leading to sales? Are your engaging tweets driving registrations for your webinar? Conversion rate provides the answers. It shifts the focus from superficial engagement to meaningful actions, allowing you to optimize content for results rather than vanity metrics. This data-driven approach helps justify social media marketing investments and enables precise campaign ROI calculations.
Features and Benefits:
- Links social media activities to business outcomes: Directly measures the impact of social media on your bottom line.
- Measures multiple conversion types: Tracks both micro-conversions (e.g., adding an item to cart) and macro-conversions (e.g., completing a purchase).
- Justifies social media marketing investments: Provides concrete evidence of the return on your social media spend.
- Enables campaign ROI calculations: Allows you to accurately measure the profitability of your social media campaigns.
Pros:
- Demonstrates actual business value of social media activities
- Helps optimize content for results rather than vanity metrics
- Justifies social media marketing investments
- Enables campaign ROI calculations
Cons:
- Attribution can be complex: Difficult to isolate the impact of social media when users interact with your brand across multiple touchpoints.
- Requires technical setup: Implementing proper tracking (UTM parameters, pixels) requires some technical expertise.
- Longer conversion path: The journey from social media engagement to conversion may be longer compared to other channels.
- Cross-device tracking limitations: Platform limitations can hinder accurate tracking of user journeys across multiple devices.
Examples of Successful Implementation:
- Fashion Nova: Leverages Instagram shopping tags to drive direct sales, achieving high conversion rates through seamless in-app purchases.
- HubSpot: Utilizes a sophisticated LinkedIn content strategy to consistently generate leads and drive conversions.
- Casper: Runs highly targeted Facebook campaigns that reportedly deliver conversion rates 5x higher than the industry average.
Actionable Tips for Improving Conversion Rate:
- Implement proper tracking: Use UTM parameters and conversion pixels to accurately track the source of your conversions.
- Create platform-specific landing pages: Optimize landing pages for social media traffic to provide a seamless user experience.
- Test different calls-to-action (CTAs): Experiment with different CTAs and conversion paths to identify what resonates best with your audience.
- Consider the full attribution model: Don’t just focus on last-click attribution. Analyze the entire customer journey to understand the role of social media at each touchpoint.
- Optimize page load times for mobile: A significant portion of social media traffic comes from mobile devices. Ensure your landing pages load quickly to avoid losing potential customers.
Popularized By:
- Avinash Kaushik: A marketing expert who emphasizes the importance of focusing on outcomes over outputs.
- Facebook’s conversion tracking tools: Facebook provides robust tools and optimization features to track and improve conversion rates.
- E-commerce platforms like Shopify: These platforms often integrate social conversion tracking to streamline the process for businesses.
By focusing on conversion rate, small and medium enterprises, micro and nano influencers, content creators, marketing professionals, and social media agencies can gain a deeper understanding of the effectiveness of their social media strategies. It empowers them to move beyond vanity metrics and optimize their efforts for tangible business results.
7. Follower Growth Rate
Follower Growth Rate is a crucial social media engagement metric that measures the speed at which your account gains new followers over a specific period. It provides a dynamic view of your audience expansion, going beyond static follower counts to reveal the velocity of your growth. This metric is essential for understanding the effectiveness of your social media strategy and for benchmarking your progress against competitors or past performance. It deserves its place on this list because it offers valuable insights into brand awareness, reach potential, and the long-term success of your social media efforts.
How It Works:
Follower Growth Rate is calculated as follows:
[(New Followers Gained During Period) / (Total Followers at the Start of Period)] x 100 = Follower Growth Rate (%)
For example, if you started the month with 1,000 followers and gained 100 new followers, your Follower Growth Rate would be [(100 / 1,000)] x 100 = 10%. You can track this metric daily, weekly, monthly, or quarterly, depending on your needs and reporting cadence.
Features and Benefits:
- Tracks Audience Expansion Velocity: Unlike simply looking at total follower counts, this metric reveals how quickly your audience is growing.
- Flexible Timeframes: Measure growth daily, weekly, monthly, or quarterly to suit your analytical needs.
- Indicates Brand Reach Potential: A growing follower base suggests increasing brand awareness and the potential for greater organic reach.
- Long-Term Strategy Evaluation: Follower Growth Rate helps you understand the long-term impact of your social media strategy and identify areas for improvement.
- Competitive Benchmarking: Comparing your growth rate to competitors can reveal valuable insights into industry trends and best practices.
Pros:
- Measures Strategy Effectiveness: Clearly shows how effective your social media activities are in attracting new followers.
- Content Performance Insights: Helps pinpoint which content or campaigns are most successful in driving follower growth.
- Organic Reach Potential: A larger audience can lead to increased organic reach and visibility for your content.
- Competitive Analysis: Allows you to benchmark your growth against competitors and identify areas where you excel or need to improve.
Cons:
- Potential for Artificial Inflation: Follower purchasing can artificially inflate this metric, providing a misleading picture of actual growth.
- Quantity vs. Quality: A high follower growth rate doesn’t necessarily translate to a highly engaged audience.
- Growth Plateaus: Growth naturally plateaus as accounts mature and reach market saturation.
- External Factors: Algorithm changes and seasonal trends can influence follower growth rates, making it important to consider these factors.
Examples of Successful Implementation:
- Rapid Growth: TikTok creator Khaby Lame’s meteoric rise from 0 to 50 million followers in under a year demonstrates the power of viral content in driving rapid follower growth.
- Steady Growth: The Museum of Modern Art (MoMA) achieves consistent 5-7% monthly growth on Instagram by focusing on high-quality art education content, demonstrating the value of a niche-focused strategy.
- Event-Driven Growth: Chess.com experienced a 400% follower growth rate during the popularity of the Netflix series “The Queen’s Gambit,” highlighting the impact of external events on social media growth.
Actionable Tips for Small Businesses, Influencers, and Marketers:
- Content Analysis: Analyze which content types correlate with follower spikes to understand what resonates with your target audience.
- Monitor Churn Rate: Track both follower growth and unfollows to calculate net growth and identify potential issues with audience retention.
- Strategic Growth Campaigns: Use contests, collaborations, and giveaways strategically to boost follower growth during specific periods.
- Prioritize Retention: Focus on retention strategies, such as community building and engaging content, alongside acquisition efforts.
- Demographic Tracking: Monitor demographic changes as your audience expands to ensure your content remains relevant and targeted.
Popularized By: Social media management platforms like Hootsuite and Sprout Social, growth hacking expert Sean Ellis, and Instagram’s emphasis on follower count.
By diligently tracking and analyzing Follower Growth Rate as part of your broader social media engagement metrics strategy, you can gain valuable insights into your audience growth, identify successful tactics, and refine your approach to achieve sustainable, long-term success on social media.
8. Video Completion Rate
Video Completion Rate (VCR) is a crucial social media engagement metric that measures the percentage of users who watch a video from beginning to end. As video content continues to dominate social media platforms, understanding and optimizing VCR has become essential for anyone seeking to maximize their impact. This metric deserves a place on this list because it provides a more nuanced understanding of audience engagement than simpler metrics like view counts, offering valuable insights into content effectiveness and resonance.
How it Works:
VCR is calculated by dividing the number of complete views by the number of video starts, then multiplying by 100. For example, if a video receives 100 starts and 50 complete views, the VCR is 50%. This metric helps assess how captivating your video content is and how well it retains viewer attention throughout its duration.
Features and Benefits:
- Measures audience retention: VCR provides insights into how well your video maintains viewer interest from start to finish.
- Identifies drop-off points: Analyzing VCR alongside viewer drop-off points helps pinpoint weaknesses in your content and identify areas for improvement.
- Platform-specific analysis: VCR can be analyzed in the context of different platforms, acknowledging varying video lengths and platform-specific definitions of ‘completion.’ This allows for tailored content strategies.
- Algorithm favorability: High VCR often correlates with improved algorithm performance, leading to increased organic reach and visibility on platforms like YouTube and Facebook.
Pros:
- Indicates content quality and relevance: A high VCR suggests that your video is engaging and resonates with your target audience.
- Optimizes video length and structure: Analyzing VCR helps determine the ideal video length for your audience and optimize the structure for maximum impact.
- Evaluates storytelling effectiveness: VCR provides valuable feedback on the effectiveness of your video’s narrative and its ability to hold viewers’ attention.
Cons:
- Length dependency: Longer videos naturally tend to have lower completion rates.
- Autoplay influence: Platform autoplay features can inflate video start counts, potentially skewing VCR calculations.
- Platform variations: Different platforms have varying definitions of “completion,” making cross-platform comparisons challenging.
- Partial value overlooked: VCR doesn’t account for the value gained from partial views, which can still contribute to brand awareness and engagement.
Examples of Successful Implementation:
- Short-form mastery: TikTok creator Zach King consistently achieves over 80% completion rates with his captivating short-form optical illusion videos.
- Engaging recipes: BuzzFeed Tasty maintains impressive 65% completion rates for their overhead recipe videos, significantly exceeding platform averages of 20-30%.
- Impactful storytelling: Nike’s ‘Dream Crazy’ campaign featuring Colin Kaepernick achieved a 55% completion rate on YouTube, demonstrating the power of compelling storytelling even with longer video formats (2+ minutes).
Actionable Tips for Improvement:
- Front-load key information: Capture viewers’ attention in the first 3-10 seconds by highlighting the most important information.
- Platform-specific design: Optimize video format and style for each platform (e.g., vertical video for Stories).
- Visual cues: Utilize progress bars or other visual cues to encourage continued viewing.
- Analyze drop-off points: Identify areas where viewers are losing interest and revise your content accordingly.
- Experiment with length: Test different video lengths to determine the optimal duration for your target audience.
When and Why to Use VCR:
VCR is a valuable metric for any business or individual using video content as part of their social media strategy. It’s particularly relevant for:
- Content creators: Understanding VCR helps refine content creation strategies and maximize audience engagement.
- Small and Medium Enterprises (SMEs): Tracking VCR allows SMEs to assess the effectiveness of their video marketing campaigns and optimize their ROI.
- Micro and Nano Influencers: VCR provides valuable data for demonstrating audience engagement to potential brand partners.
- Marketing Professionals and Social Media Agencies: Analyzing VCR enables data-driven decision-making for optimizing video content strategies and achieving campaign objectives.
By understanding and leveraging Video Completion Rate, you can gain valuable insights into your audience’s viewing habits, optimize your video content for maximum impact, and ultimately achieve greater success on social media.
Social Media Engagement Metrics Comparison
| Metric | Implementation Complexity 🔄 | Resource Requirements ⚡ | Expected Outcomes 📊 | Ideal Use Cases 💡 | Key Advantages ⭐ |
|---|---|---|---|---|---|
| Engagement Rate | Moderate: Requires accurate tracking of engagements and follower count; platform variations exist | Low to Moderate: Data accessible via platform analytics | Measures content resonance and standardized audience engagement | Comparing content performance; benchmarking across account sizes | Standardizes engagement relative to audience; identifies popular content |
| Reach | Low: Simple count of unique users who viewed content | Low: Provided natively by platforms | Assesses content visibility and potential audience size | Evaluating brand awareness and distribution strategies | Measures actual audience exposure; foundation for other metrics |
| Click-Through Rate (CTR) | Moderate: Needs proper tracking setup (UTMs, pixels) | Moderate: Tracking and analytics tools required | Indicates audience action-taking and effectiveness of calls-to-action | Driving traffic to websites, lead generation | Directly measures audience response and website traffic generation |
| Shares/Retweets/Reposts | Low to Moderate: Counting shares is straightforward, but prompting shares is complex | Low: Platform-native metrics | Expands content reach exponentially; reflects strong user endorsement | Amplifying reach and viral marketing campaigns | Highly valuable engagement; boosts organic reach significantly |
| Comments and Replies | Moderate to High: Requires moderation and sentiment analysis tools | Moderate to High: Community management resources needed | Measures active engagement and community building | Community engagement; feedback collection | Provides rich audience insights; fosters brand-user relationship |
| Conversion Rate | High: Requires tracking setups (pixels, UTM, journey mapping) | High: Technical setup, analytics platforms | Directly ties social media to business outcomes and ROI | Sales, lead generation, goal completions | Demonstrates real business impact; justifies social media investment |
| Follower Growth Rate | Low to Moderate: Requires tracking follower counts over time | Low: Accessible via analytics dashboards | Indicates audience expansion velocity and brand awareness growth | Long-term strategy evaluation and benchmarking | Measures growth momentum; signals brand popularity expansion |
| Video Completion Rate | Moderate: Requires video analytics with start and completion data | Moderate: Video hosting platforms and analytics tools | Reflects content engagement quality and audience retention | Video marketing effectiveness assessment | Shows video relevance and quality; aids in optimizing video content |
Elevating Your Social Media Game with REACH Influencers
Mastering social media engagement metrics is no longer a luxury, but a necessity in today’s digital landscape. From engagement rate and reach to conversion rates and video completion, understanding these key performance indicators (KPIs) empowers data-driven decisions that fuel impactful social media strategies. By analyzing metrics like shares, comments, and follower growth rate, you gain invaluable insights into your audience’s preferences, allowing you to refine your content, boost visibility, and ultimately, achieve your marketing objectives. These insights are crucial for anyone working with social media, whether you’re a small business owner, a burgeoning nano influencer, a seasoned content creator, a marketing professional, or a social media agency. Optimizing your approach based on these social media engagement metrics is the key to unlocking genuine growth and tangible results in 2025 and beyond.
The most important takeaway? Data-driven decision-making is the future of social media success. By prioritizing and actively tracking these eight metrics, you can transform your social media presence from a guessing game into a powerful engine for growth and connection.
Ready to take your social media engagement metrics to the next level and supercharge your campaigns? REACH Influencers provides the tools and resources to connect with passionate content creators who can authentically amplify your brand message and boost those all-important engagement metrics. Visit REACH Influencers today to discover the power of influencer marketing and unlock the full potential of your social media strategy.
