

It's one thing for an influencer's post to get a lot of likes, but it's another thing entirely for that post to actually make you money. To truly understand if your influencer campaigns are working, you have to look at both—the engagement and the return on investment (ROI). This means tracking not just the hearts and comments, but the hard data on sales and signups. A solid strategy to measure influencer engagement and ROI is no longer a "nice-to-have"—it's a critical component of a successful marketing program.
The goal is to shift your mindset from simply counting followers to proving real, measurable business value. With the right tools and frameworks, this process becomes straightforward. Platforms like REACH Influencers are designed specifically for this, providing a centralized dashboard to track every metric from initial impressions to final sales, ensuring you can demonstrate clear returns on your investment.
Table of Contents
- Moving Beyond Likes to Measure Real Impact
- Setting KPIs That Align with Business Goals
- The Real Formulas for Calculating Influencer Engagement
- A Practical Framework to Calculate Influencer ROI
- Turning Data into Actionable Campaign Reports
- Frequently Asked Questions About Influencer ROI
Moving Beyond Likes to Measure Real Impact
Let's be honest: vanity metrics like follower counts and raw likes don't pay the bills. The real measure of success in influencer marketing is connecting your spending to tangible business outcomes. It’s about building a data-backed case that shows exactly how these collaborations are helping you grow.
When you can do that, you're not just running campaigns; you're building a scalable, predictable engine for your brand.

This modern approach means digging deeper than the surface-level stats. Smart marketers now focus on things like engagement rates, true reach, and impressions to see how well the content is actually connecting with the right people. If you want a full rundown of the fundamentals, this ultimate guide to influencer marketing is a great place to start before we get into the nitty-gritty of the numbers.
From Impressions to Income
Tracking ROI is all about following the customer's journey, from the moment they see an influencer's post to the second they click "buy now." To do this effectively, you need a system that can connect all those dots. This is where dedicated platforms really shine.
For example, a platform like REACH Influencers is designed to handle this from end to end. It gives you a single place to track everything that matters, from the initial engagement on a post all the way to the final sale. No more wrestling with spreadsheets or trying to manually piece together data from different sources.
Instead of guessing which influencer is performing best, you can see clear data. Who drove the most traffic? Whose content converted at the highest rate? That's the kind of insight that lets you double down on what works and cut what doesn’t.
The Metrics That Matter Most
To effectively measure influencer engagement and ROI, you have to know what to look for. Focusing on the right Key Performance Indicators (KPIs) is the foundation of any solid measurement strategy. These are your guideposts for success.
Here's a quick look at the essential metrics you should be tracking to get a full picture of your campaign's health.
Essential Metrics for Influencer Campaign Measurement
This table summarizes the core KPIs for tracking both influencer engagement and the financial return of your campaigns.
| Metric Category | Key Performance Indicator (KPI) | What It Measures |
|---|---|---|
| Audience Response | Engagement Rate | The percentage of an influencer's audience that actively interacts with content. |
| Cost Efficiency | Cost Per Engagement (CPE) | How much you pay for each like, comment, or share. |
| Traffic Generation | Click-Through Rate (CTR) | The percentage of viewers who click a specific link in the influencer’s content. |
| Business Impact | Conversion Rate | The percentage of clicks that lead to a desired action, like a purchase or signup. |
By keeping an eye on these numbers, you move from vague feelings about a campaign's performance to concrete, data-driven conclusions.
It’s easy to get dazzled by huge follower counts, but the data tells a different story. The best ROI often comes from micro and mid-tier influencers. In fact, they are preferred by 73% of brands because they deliver much better engagement for the cost.
This is why precise attribution is non-negotiable. Using unique tracking links or custom discount codes for each influencer is the only way to know for sure who is driving traffic and sales. It’s a simple but powerful technique for proving exactly where your revenue is coming from.
Setting KPIs That Align with Business Goals
Before you even think about ROI, you have to answer a simple question: what does success look like for this campaign? If you don't define your goals upfront, you’re just throwing money at influencers and hoping for the best. Good luck explaining that to your boss.
Setting the right Key Performance Indicators (KPIs) from the get-go is the only way to build a measurement framework that proves your campaign’s worth.
Your KPIs need to be a direct line to your bigger business objectives. Are you trying to blast a new product onto the scene and get in front of millions of eyeballs? Or do you need to feed your sales team a steady stream of qualified leads? Each of these goals demands a completely different set of metrics.
This is where a solid platform like REACH Influencers really shines. Instead of drowning in a sea of vanity metrics, you can pick and track the specific KPIs that matter for your campaign, right from the dashboard. It keeps everyone focused and gives you a clear picture of what’s working from day one.
Awareness vs. Engagement vs. Conversion: Know The Difference
Not all metrics are created equal. Some build buzz, others build relationships, and a select few build your bottom line. Understanding where each KPI fits in the marketing funnel is crucial for telling the whole story of your campaign.
Think about it this way: a campaign for a new energy drink has wildly different goals than one for a B2B software tool. You wouldn't measure them the same way.
-
Awareness KPIs (Top of Funnel): This is all about eyeballs. These metrics show you how many people saw your campaign and are perfect for boosting brand visibility.
- Reach: The total number of unique people who laid eyes on the influencer’s content.
- Impressions: The total number of times the content popped up on a screen, even if the same person saw it multiple times.
-
Engagement KPIs (Middle of Funnel): This is where you see if people actually care. High engagement means your message is hitting home with the right audience.
- Likes, Comments, Shares: The classic signs that people are paying attention and interacting.
- Saves: This is a huge one. It signals the content is so valuable people want to come back to it later.
- Click-Through Rate (CTR): The percentage of people who were compelled enough to click a link.
-
Conversion KPIs (Bottom of Funnel): These are the money metrics. They tie your influencer campaign directly to business results.
- Sales/Revenue: The amount of cash you generated, tracked with unique discount codes or UTM links.
- Cost Per Acquisition (CPA): How much you spent to land each new customer from the campaign.
- Lead Generation: The number of new email sign-ups, demo requests, or downloads.
By sorting your KPIs this way, you get a much richer view of your campaign's performance. For a deeper look at this, check out our full guide on choosing the right influencer marketing KPIs for your brand.
Putting It All Into Practice: Real-World Scenarios
Let's make this tangible. Here’s how two very different brands might approach their KPIs.
Scenario 1: A DTC Beauty Brand Launching a New Serum
The goal here is simple: make a splash and drive immediate sales.
- Primary KPI: Sales Revenue. This is easily tracked by giving each influencer a unique discount code.
- Secondary KPIs:
- Engagement Rate: Helps identify which influencer's content style really connects with the target audience for future campaigns.
- Click-Through Rate (CTR): Measures how many people were interested enough to visit the product page.
- Cost Per Acquisition (CPA): Keeps the campaign profitable and proves its efficiency.
A million impressions might look good on paper, but for a product launch, sales are what truly matter. Success isn't just about how many people saw the serum—it's about how many bought it.
Scenario 2: A B2B Software Company Promoting a New E-book
Here, the objective isn't an instant sale. It's about capturing high-quality leads for the sales pipeline.
- Primary KPI: Lead Generation (E-book Downloads). Track this by giving each influencer a unique landing page link.
- Secondary KPIs:
- Website Traffic: Shows how many potential customers are exploring the site after the initial interaction.
- Cost Per Lead (CPL): Calculates how efficiently you're generating those valuable leads.
- Audience Quality: A gut check to ensure the influencer's followers actually match your ideal customer profile.
In this situation, a post getting tons of likes is far less important than the number of actual marketing managers who downloaded the e-book. The KPIs are laser-focused on the business outcome: filling the sales funnel, not the cash register. Nailing these goal-oriented KPIs is the first and most critical step to confidently measure influencer engagement and ROI.
The Real Formulas for Calculating Influencer Engagement
Alright, once you’ve figured out what success actually looks like for your campaign, it's time to crunch some numbers. The word "formula" might give you flashbacks to high school math, but don't worry—calculating influencer engagement is actually pretty straightforward.
The goal here is to move beyond vanity metrics like raw likes and comments. We need to turn those numbers into standardized rates that let you compare performance apples-to-apples, whether you're looking at a micro-influencer on TikTok or a mega-star on Instagram. These formulas are the bedrock of how you measure influencer engagement and ROI, giving you a real sense of how well an influencer's content actually connects with their audience.
Engagement Rate Per Post (ER Post)
This is the classic, the one everyone starts with. It measures the engagement on a single post against an influencer’s total follower count. Think of it as a quick, back-of-the-napkin calculation to see how a piece of content landed.
The formula is simple enough:
(Total Likes + Comments + Shares + Saves) / Total Followers x 100
Let's say you're working with an influencer who has 100,000 followers. Their sponsored post gets 4,000 likes, 500 comments, 200 shares, and 300 saves.
Here’s how the math plays out:
(4,000 + 500 + 200 + 300) / 100,000 x 100 = 5.0% ER Post
So, 5% of their total follower base engaged with that post. It’s a solid starting point, but it has a major blind spot: algorithms ensure that not every follower sees every post. That's why the next formula is often much more revealing.
My Takeaway: ER Post is a good baseline, but it can be misleading if an influencer has a large chunk of inactive or "ghost" followers. I always use it as an initial filter, but never as the final word on performance.
Engagement Rate by Reach (ERR)
This is where things get interesting. Engagement Rate by Reach (ERR) is a far more accurate gauge of a post's true impact. Instead of dividing by followers—many of whom never even saw the content—this formula uses the actual number of unique people who saw the post (reach).
It gives you a much clearer picture of how compelling the content was to the audience it actually got in front of.
The formula for ERR is:
(Total Engagements / Total Reach) x 100
Using our same example, the post received 5,000 total engagements. But let's say the influencer’s analytics show it only reached 40,000 unique people.
5,000 / 40,000 x 100 = 12.5% ERR
Look at that difference. The ER Post was just 5%, but the ERR is a whopping 12.5%. This tells a completely different story. It means the content was incredibly effective with the people who saw it, which is a powerful indicator of a successful collaboration. The only catch? You have to get this reach data directly from the influencer, as it’s not public.
Engagement Rate on Views (ER Views) for Video
When it comes to video on platforms like TikTok, YouTube, and Instagram Reels, views are the name of the game. A video can easily go viral and be seen by millions of people who don't even follow the creator. That’s why we need a formula that accounts for this.
The calculation for ER Views is:
(Total Engagements / Total Video Views) x 100
Imagine a TikTok video blows up, getting 500,000 views. Along the way, it collects 20,000 likes, 1,500 comments, and 2,500 shares. That's 24,000 total engagements.
24,000 / 500,000 x 100 = 4.8% ER Views
This metric tells you how captivating the video itself was, completely separate from the influencer’s follower count. A high ER Views is a sign of truly thumb-stopping content.
Putting It All Together with REACH Influencers
Trying to calculate these metrics manually for every single post across a dozen influencers is a fast track to burnout and spreadsheet nightmares. Honestly, it's just not a good use of anyone's time. This is exactly why platforms like REACH Influencers exist—to automate the entire process.
REACH syncs directly with social media APIs to pull all the necessary data—likes, comments, reach, views, you name it—into one clean, real-time dashboard.
- Ditch the Spreadsheets: Forget manual data entry. All the engagement formulas are calculated for you, instantly.
- Get Real-Time Data: Stop waiting for influencers to send you screenshots. See performance as it unfolds.
- Find Deeper Insights: The platform automatically benchmarks an influencer’s performance against their own history and industry averages, giving you crucial context.
This kind of automation frees you up to focus on the strategic side of things—analyzing what the data means and making smarter decisions for your next campaign.
If you want to play around with these numbers yourself, our handy influencer engagement rate calculator is a great place to start. Getting comfortable with these core formulas is the first step to truly being able to measure influencer engagement and ROI.
A Practical Framework to Calculate Influencer ROI
While likes and comments are great for gauging audience sentiment, the real test of any campaign is its financial return. This is where we bridge the gap between marketing spend and actual business growth. Building a solid framework to track influencer ROI isn't just about justifying your budget—it's about making smarter, data-driven decisions for every campaign that follows.
The core formula for Return on Investment (ROI) is actually quite straightforward:
ROI = [(Return – Investment) / Investment] x 100
This gives you a simple percentage that shows exactly how much you earned for every dollar you put in. For instance, an ROI of 450% means you generated $4.50 in net profit for each dollar invested.
The real trick, of course, is accurately defining what goes into the "Return" and "Investment" buckets.
Nailing Down Your Total Investment
First up, let's get a handle on the costs. Your total investment is almost always more than just the fee you pay an influencer. To get a true picture, you have to account for every single expense tied to the campaign.
- Influencer Compensation: This is the obvious one—direct payments, commissions, or any other agreed-upon fees.
- Product Costs: Don't forget the retail value of any gifted products, plus what it costs you to ship them.
- Agency or Platform Fees: If you're working with an agency or using a platform like REACH, those subscription or management fees are part of the investment.
- Content Production: Did you have a professional photoshoot, hire a video editor, or cover travel expenses? Add those in.
- Ad Spend: If you're putting money behind the influencer's post to boost its reach, that budget counts, too.
Adding all these up gives you the "Investment" figure for your formula. Getting this right is the first step to an honest ROI calculation.
Tracking Returns with Precision
Now, for the "Return" side of things. This is where meticulous tracking becomes absolutely critical. You need airtight methods to attribute sales and other valuable actions directly back to your influencer's work.
Here are the most reliable ways I've seen this done:
- UTM Parameters: These are small bits of code you add to a URL to track where a visitor came from. By giving each influencer their own unique UTM link, you can jump into Google Analytics and see exactly how much traffic and revenue they drove.
- Unique Discount Codes: A classic for a reason. Assigning a custom code like "SOPHIE15" to each creator makes it incredibly easy to track sales right from your e-commerce dashboard.
- Affiliate Links: These work a lot like UTMs but are often tied to a commission for the influencer. Modern platforms can automate this entirely, integrating with systems like Shopify to remove all the manual tracking headaches.
Engagement is the leading indicator for a strong return, and understanding how to measure it is key.
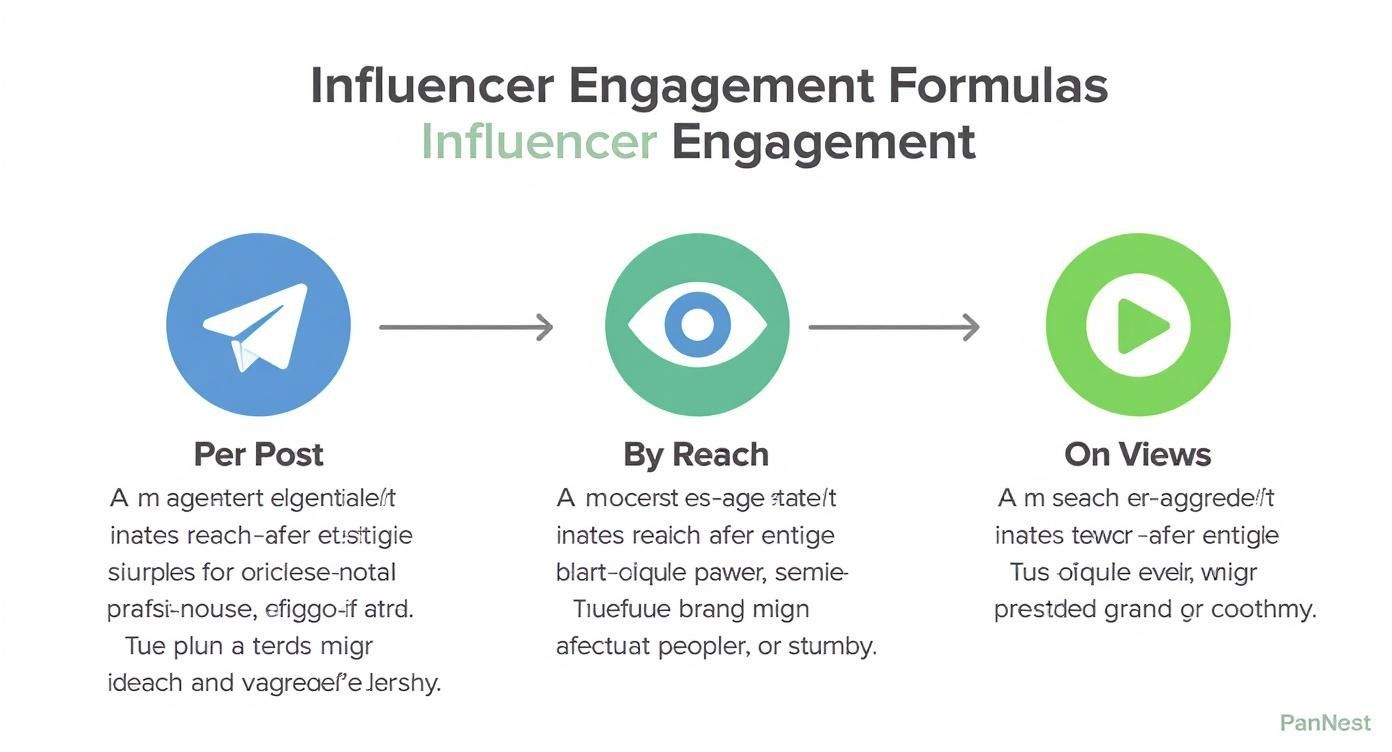
As you can see, you can measure engagement against followers, reach, or views. Each one tells a slightly different story about how the content is performing and resonating with the audience.
Quantifying the Intangibles with Earned Media Value
Not every return shows up as a direct sale. A huge chunk of an influencer campaign's value comes from the organic buzz and credibility it generates—things you can't track with a discount code.
This is where Earned Media Value (EMV) comes into play.
EMV puts a dollar value on the organic engagement and impressions your campaign earned. It essentially answers the question: "How much would we have had to pay in traditional advertising to get this same level of exposure?"
There are different ways to calculate it, but a common method is to assign a monetary value to each action (e.g., a like is worth $0.25, a comment $1.00) and multiply by the total volume. While it’s not a direct sales figure, EMV is an incredibly powerful metric for showing the brand-building value of a campaign to stakeholders.
If you want to explore the wider principles of calculating marketing returns, this guide on measuring content marketing ROI is a fantastic resource.
On average, businesses earn an impressive $5.78 in sales or earned media for every dollar spent on influencer marketing. Even more telling, the top 13% of campaigns pull in $18 or more in revenue for every dollar invested, crushing the returns from most traditional ad channels.
Choosing the Right Attribution Model
Finally, you need to think about your attribution model. This is the framework you use to assign credit for a sale when a customer interacts with multiple marketing touchpoints before converting.
Think about it: a customer might first see your product in an influencer's post, then click a Google ad a week later, and finally make a purchase. Who gets the credit? The influencer, the ad, or both?
Your choice of attribution model directly impacts your ROI calculations. Here’s a quick breakdown of the most common ones to help you decide.
| Attribution Model | How It Works | Best For |
|---|---|---|
| First-Touch | Gives 100% of the credit to the very first touchpoint in the customer's journey. | Understanding which channels are best at generating initial awareness. |
| Last-Touch | Gives 100% of the credit to the final touchpoint before the conversion. | Identifying which channels are most effective at closing deals. |
| Linear | Distributes credit equally among all touchpoints in the journey. | Campaigns with a long sales cycle where every interaction matters. |
| Time-Decay | Gives more credit to touchpoints closer to the time of conversion. | Short promotional campaigns or B2C sales where recent interactions are more influential. |
| U-Shaped | Gives 40% of the credit to the first touch and 40% to the last, distributing the remaining 20% among the middle touches. | Valuing both the initial discovery and the final conversion drivers. |
Choosing the right model depends entirely on your campaign goals. There's no single "best" answer, but understanding how each one works is crucial for reporting an ROI that accurately reflects what your influencer campaigns are achieving.
Turning Your Data into Actionable Campaign Reports
Raw data is just a collection of numbers until you give it a story. Your engagement rates, conversion metrics, and ROI percentages don't mean much if they stay locked away in a spreadsheet. The final, and arguably most important, step is to weave that data into clear, actionable reports that prove your campaign's value and guide your next move.
This isn't about creating some massive document that collects digital dust. It’s about building a narrative that celebrates your wins, honestly assesses the challenges, and lays out a clear roadmap for what's next.
A truly great report doesn't just show what happened; it explains why it happened and tells you what to do next. This is how you stop just running campaigns and start building a strategic, repeatable growth engine for your brand.
Building Your Comprehensive Influencer Report
The real goal here is to create a report that’s both detailed and incredibly easy to digest for everyone involved, from your marketing team to the C-suite. It needs to clearly communicate performance, shine a spotlight on your best talent, and tie every single result back to the bottom line. Trying to pull this all together manually is a monster of a task, which is exactly why a platform like REACH Influencers becomes so essential.
REACH can automate this entire headache, generating professional, customizable reports in minutes. It pulls all your crucial campaign data—from engagement trends right down to sales attribution—into clean, visual dashboards. This makes your performance story not just easy to understand, but compelling. If you want to see what this looks like in practice, check out our free influencer marketing report template to get a feel for the core components.
So, what should be in every report you create? Make sure you hit these key sections:
- Executive Summary: Start with the punchline. This is a high-level look at the campaign's goals, top results, and major takeaways. Lead with your most important numbers, like total ROI and cost per acquisition.
- Performance vs. KPIs: This is your report card. Directly compare your results against the initial goals you set. Did you hit that target engagement rate? Did you blow past your sales projections? This section provides immediate, crucial context.
- Overall Campaign Metrics: Now you can zoom out for the bird's-eye view. This is where you put the big, aggregate numbers: total impressions, engagements, clicks, conversions, and of course, total ROI.
A powerful report answers critical questions before they are even asked. It should proactively tell stakeholders which influencer types drove the most conversions, what content formats resonated best, and how the budget can be better optimized next quarter.
Identifying Top Performers and Content
Beyond the big-picture numbers, your report needs to dig into the details that show you what really worked. This is where you find the golden nuggets of insight that will make your next campaign even better. The ability to effectively measure influencer engagement and ROI really hinges on understanding these nuances.
Make sure you’re highlighting these specific areas:
- Top-Performing Influencers: Think of it as a leaderboard. Rank your creators by the metrics that matter most, whether that's engagement rate, conversion rate, or total sales generated. This immediately tells you who your most valuable partners are.
- Best-Performing Content: Go beyond the numbers and showcase the actual posts, videos, or Stories that drove the best results. Include screenshots and break down why they worked. Was it the call-to-action? The raw, authentic creative style? The specific messaging?
This kind of analysis isn't just for looking back; it’s for planning ahead. Knowing that a specific influencer's "get ready with me" videos drove 3x more sales than their polished flat lays is a game-changing insight for future collaborations.
Visualizing Data for Impact
Let's be honest: a list of numbers is easy to ignore. The same numbers in a chart? That tells a story. Visualizing your data is absolutely critical for making your report impactful and easy for anyone to understand at a quick glance.
Try to work in visual elements like these:
- Trend Graphs: Use line charts to show how engagement or sales grew over the course of the campaign.
- Pie Charts: These are perfect for breaking down audience demographics or showing which platforms performed best.
- Bar Charts: Nothing beats a simple bar chart for comparing influencer performance side-by-side to instantly spot your winners.
In the end, a strong report does so much more than just justify your spending. It becomes an essential tool that builds confidence in your strategy, helps secure bigger budgets for the future, and makes your entire influencer program smarter and more effective with every campaign. It’s the final, crucial step in turning raw data into measurable success.
Still Have Questions About Influencer ROI?
Even when you have a solid plan, a few tricky questions always seem to pop up once you get into the weeds of measuring influencer marketing. Let's tackle some of the most common ones I hear from marketers so you can move forward with total confidence.
How Can I Actually Track Sales from Instagram Stories?
This is the million-dollar question, isn't it? Especially when you can't just drop a clickable link everywhere. The most reliable way to handle this is with unique, memorable discount codes.
Give each influencer their own code—something simple like "SOPHIA15" or "MIKE20". It’s a win-win: customers get a deal, and you can see exactly who sent them your way right in your e-commerce dashboard. The data is clean, and the attribution is crystal clear.
Another great trick, though it’s a bit softer, is the post-purchase survey. Just add a simple "How did you hear about us?" question at checkout and list your influencers as options. It’s a fantastic way to catch the sales that even discount codes might miss.
My Two Cents: For platforms that are stingy with links, unique discount codes are your best friend. They cut through the noise and give you undeniable proof of who's driving sales, making your ROI calculation a breeze.
What’s a “Good” Engagement Rate, Really?
Honestly, there’s no magic number here. A "good" engagement rate is all about context. What’s fantastic for one campaign might be average for another.
It really depends on a few things:
- The Platform: You'll almost always see higher engagement on TikTok and YouTube Shorts compared to Instagram or Facebook.
- The Influencer: Micro-influencers (those with 10k-100k followers) are engagement powerhouses, often hitting 3-6% on Instagram. Mega-influencers with millions of followers? They're usually closer to 1-2%.
- The Niche: A passionate community in fitness or beauty is naturally going to generate more comments and likes than a more B2B-focused industry.
Instead of hunting for a universal benchmark, measure an influencer against themselves. How does this campaign's engagement compare to their usual posts? How does it stack up against your past campaigns? That’s where you’ll find the real story. A platform like REACH Influencers can give you a head start by showing you an influencer’s average engagement rate before you even reach out.
How Do I Measure ROI for a Brand Awareness Campaign?
When your goal is eyeballs, not immediate sales, you have to think about ROI a little differently. You can't track revenue if revenue isn't the point. Your focus should be on measuring the value of the attention you’ve earned.
This is where a metric like Earned Media Value (EMV) becomes incredibly powerful. EMV essentially puts a dollar figure on all the organic impressions, reach, and engagement your campaign generated. It answers the simple question: "What would this have cost us if we'd paid for it as traditional advertising?"
Beyond EMV, you should also be tracking a handful of other key awareness metrics:
- Reach and Impressions: How many unique people saw the content, and how many total times was it seen?
- Video Views and View-Through Rate: For video, did people watch it? And for how long?
- Brand Mentions and Share of Voice: Are more people talking about your brand organically now?
- Website Traffic and Branded Search: Did you see a bump in people coming directly to your site or searching your brand name on Google during the campaign?
When you pull all of this data together, you can paint a very clear picture of the financial value your awareness campaign created, even without direct sales figures. This guide has provided the frameworks you need to measure influencer engagement and ROI effectively.
Ready to stop guessing and start proving the value of your influencer campaigns? REACH Influencers gives you all the tools you need to track engagement, attribute sales, and calculate ROI with precision. Ditch the spreadsheets and see exactly what’s working. Schedule your demo today and take control of your influencer marketing measurement.
