

It’s time to get real about social media measurement. If you're still leading with follower counts and likes in your reports, you're missing the point. The game-changer is shifting your focus from these vanity metrics to the hard data that actually moves the needle for your business—think conversion rates, lead generation, and ROI.
This isn't just about tweaking your reports; it's about transforming social media from a "nice-to-have" branding exercise into a powerhouse for business growth.
Moving Beyond Likes And Follows
Let's be honest, justifying your social media budget with a growing follower count feels a bit hollow, doesn't it? The real challenge—and where the real value lies—is in drawing a straight line from your social activity to tangible business outcomes. This is where a strategic approach to measurement becomes non-negotiable.
When you consistently track goal-oriented metrics, you stop guessing and start understanding what truly resonates with your audience. It tells you where to put your money for the best return and, critically, gives you the ammunition to prove your team's value. This is how you change the conversation from "building brand awareness" to "driving sales and generating leads." The key is mastering the social media metrics that truly matter for your specific goals.
Why Measurement Secures Your Strategy
Without solid data, your social media strategy is built on a foundation of guesswork. Proper measurement provides the cold, hard evidence you need to make smart decisions, fine-tune your campaigns, and get the resources you need to win.
Here’s why it’s so critical:
- It Validates Your Efforts: Clear metrics show the direct impact of your work on the bottom line. Suddenly, your department isn't a cost center; it's a revenue generator.
- It Guides Content Creation: By seeing what drives actual engagement and conversions, you can double down on what works and ditch what doesn’t. Your performance will naturally improve over time.
- It Uncovers Audience Insights: The data tells a story about who your audience is, what they care about, and how they behave online. This allows for laser-focused targeting and messaging.
The goal is to build a narrative backed by numbers. When you can walk into a strategy meeting and say, "Our Instagram campaign generated 50 qualified leads last month with a 3% conversion rate," you're speaking the language business leaders understand.
The sheer scale of social media makes this essential. In 2025, we're looking at around 5.45 billion users worldwide. People are spending nearly two and a half hours every single day across roughly seven different platforms.
And they aren't just scrolling. A solid 25.9% of users are on social media actively looking for products to buy. The commercial opportunity is massive, and it solidifies social media’s place in the modern consumer journey. Learning to measure your efforts isn't just about reporting—it's about securing your budget and earning your seat at the strategy table.
Connecting Your Metrics To Business Goals
It’s easy to get lost in a sea of data. A cluttered analytics dashboard often signals a social media strategy that lacks focus. The key to measuring your social media performance effectively isn't to track everything—it's to track the right things. Every single metric you watch should directly answer a critical question about how you’re progressing toward your core business objectives.
Remember, your business goals should always drive your metrics, not the other way around. Think about it: a B2B software company trying to book more demos has completely different priorities than an e-commerce brand driving online sales. The B2B company will be laser-focused on click-through rates for its "Book a Demo" links and the conversion rates on its landing pages. Meanwhile, the e-commerce brand is probably obsessed with add-to-cart actions and calculating the social media ROI from specific product campaigns. Same platforms, different definitions of success.
Aligning Metrics With Key Objectives
Before you can measure anything, you have to be crystal clear about what you're trying to accomplish. Most social media strategies boil down to a handful of primary goals. By pairing each of those goals with specific, relevant metrics, you build a measurement framework that actually tells you a story.
Here's a practical way to think about it:
- Building Brand Awareness: If you just want to get your name out there, your go-to metrics are reach, impressions, and audience growth rate. These tell you how many unique people are seeing your content and how quickly your potential audience is expanding.
- Driving Audience Engagement: To build a real community, you need to look beyond likes. Focus on comments, shares, and saves. These actions signal a much deeper connection and show that your content is compelling enough for someone to interact with or come back to later.
- Generating Leads: When it's time to fill the sales pipeline, the numbers that matter most are click-through rate (CTR) on your links, form completions from social traffic, and your overall cost per lead. This is where social media proves it can deliver tangible business prospects.
- Fostering Customer Loyalty: For keeping your current customers happy, keep an eye on repeat customer purchases originating from social media and track your brand's social sentiment. Positive shout-outs and repeat business are undeniable signs of a loyal fan base.
This chart shows just how powerful engagement can be for getting a real-time pulse on your content.
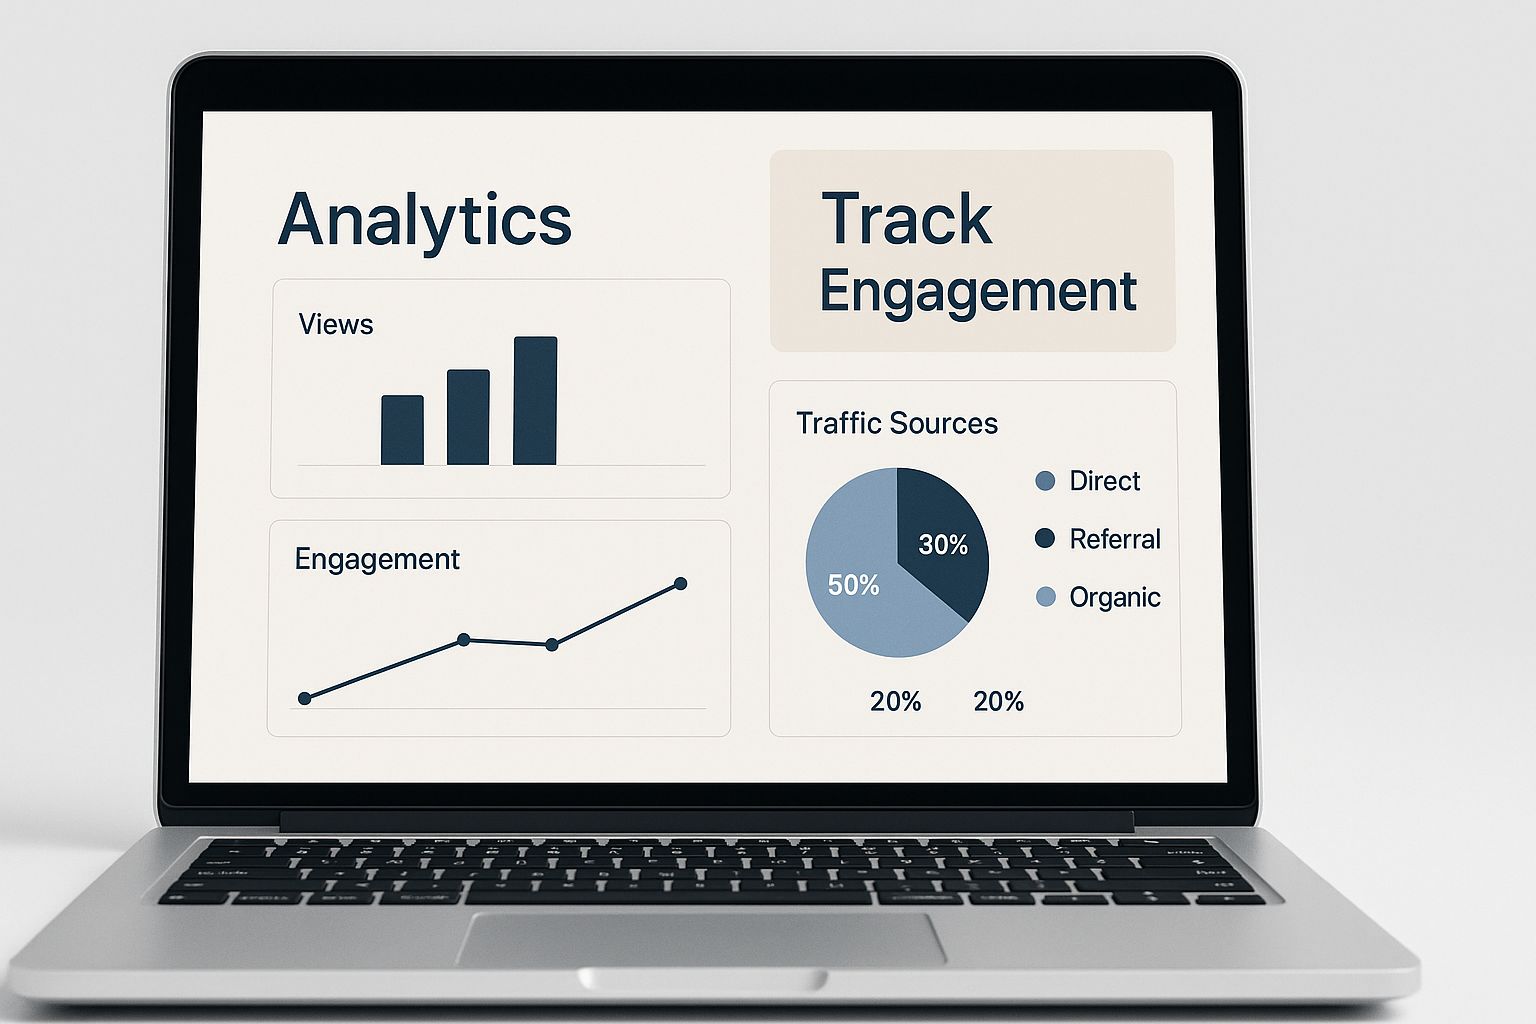
As you can see, engagement metrics give you immediate feedback, helping you quickly figure out what resonates with your audience and what falls flat.
Tying Social Activity To Broader Business Impact
To really prove the value of social media, you have to look beyond the immediate numbers on your dashboard and connect them to wider business outcomes.
For example, a high engagement rate is great, but what does it do for the business? Well, strong engagement often sparks a wave of user-generated content. From there, a savvy marketer can start leveraging user-generated content for SEO to boost the company's website rankings. Suddenly, a simple social interaction is contributing to a major business goal like organic search visibility.
To help you get started, here’s a quick-reference table that connects common business goals with the metrics you should be tracking.
Matching Social Media Metrics to Business Objectives
This table provides a clear guide on which social media metrics to prioritize based on your primary business goal, helping you focus your measurement efforts.
| Business Goal | Primary Metrics to Track | What These Metrics Tell You |
|---|---|---|
| Brand Awareness | Reach, Impressions, Audience Growth Rate | How many people are seeing your brand and how your potential audience is growing over time. |
| Audience Engagement | Likes, Comments, Shares, Saves | How actively your audience is interacting with your content and building a community around your brand. |
| Lead Generation | Click-Through Rate (CTR), Form Completions, Cost Per Lead (CPL) | How effectively your social content is driving potential customers into your sales funnel. |
| Website Traffic | Clicks, Referral Traffic, Bounce Rate | How many people are moving from your social profiles to your website and what they do once they arrive. |
| Sales & Conversions | Conversion Rate, Social Media ROI, Average Order Value (AOV) | The direct impact of your social media efforts on sales and revenue. |
| Customer Loyalty | Social Sentiment, Repeat Purchase Rate, Customer Mentions | How happy your existing customers are and whether they are advocating for your brand. |
By using a framework like this, you can ensure that every piece of data you collect serves a distinct purpose, moving you closer to your ultimate business objectives.
The sheer scale of social media today makes this alignment absolutely critical. As of mid-2025, there are a staggering 5.41 billion social media users worldwide—that’s 65.7% of the entire global population. With an average of 7.6 new users joining every second, you can be certain your target audience is on these platforms.
When you filter out the noise and concentrate on the vital few metrics tied to your business goals, your social media reports transform. They stop being a confusing spreadsheet and become a powerful, concise pulse on your performance. This is how you prove value, justify your budget, and make truly data-driven decisions.
Building Your Social Media Measurement Toolkit
Knowing what to track is only half the battle. The other half is figuring out how to track it all without getting overwhelmed. You don't need a massive, expensive software suite right out of the gate. The trick is to build a smart, scalable measurement stack that can grow right along with your strategy.
Honestly, the best place to begin is with the tools you already have. Every major social platform—from Meta to LinkedIn—offers its own native analytics, and they are surprisingly robust if you know where to dig in.
These built-in dashboards are your foundation. They’re fantastic for getting a quick read on how your content is performing on that specific platform, all without spending a dime.
Start with Native Analytics
Before you even think about paid software, get your hands dirty with the free data each platform gives you. These native tools are your direct line to the truth of what's happening on each network.
For example, Instagram Insights will tell you exactly how many people saved your post, a huge signal that you've created truly valuable content. Over on LinkedIn, you can see the job titles of the people engaging with your updates—an absolute goldmine for any B2B marketer.
The main catch? You're looking at each platform in its own little world. This makes comparing your Instagram performance against your LinkedIn efforts a very manual, often tedious, process. As you scale, you’ll need to understand all the different types of social media engagement metrics to paint a complete picture.
My best advice is to always start by maxing out your free resources. Really master the native analytics for each channel first. Once you understand their strengths and limitations inside and out, you'll know exactly what you need from a paid tool—and you'll only pay for features you’ll actually use.
Level Up with Third-Party Tools and Tracking
Once you're juggling a few different platforms, hopping between native dashboards becomes a huge time sink. This is the point where a dedicated third-party tool like Sprout Social or Hootsuite becomes a lifesaver. These platforms pull all your data into one place, so you can see your cross-channel performance at a glance and whip up reports in minutes.
But if you want to truly connect your social media efforts to real business outcomes, you need to master UTM parameters. Think of them as little tracking codes you add to the end of your URLs. They tell your analytics software precisely where every single website visitor came from.
With UTMs, you can finally see if a click came from your Instagram Story link or a specific post on LinkedIn. It gives you undeniable proof of what's actually driving traffic and, ultimately, conversions.
This is what that data looks like inside Google Analytics.
You can see exactly which channels are sending people to your site. This is how you measure the direct, tangible impact of your social media campaigns on the bottom line.
Turning Your Data Into Actionable Insights
Collecting data is just the starting line. The real magic happens when you look at a spreadsheet and ask, "So what?" Raw numbers are just noise until you connect them to what’s actually happening with your audience and turn them into a concrete plan.
Think about it this way: your latest report shows a massive spike in reach, but your engagement rate is dead flat. What does that tell you? Instead of just logging the numbers, you need to dig in. This pattern usually means your content got in front of a lot of new eyes, but they weren't the right eyes. It was seen, but it didn't resonate enough to earn a click or a comment.
This is where you shift from being a data collector to a data detective. Every metric tells part of a story, and your job is to piece it all together to understand the "why" behind your performance.
Diagnosing Common Performance Scenarios
Let's say you notice a sudden, sharp drop in clicks from your Instagram Stories. Don't panic. It's time to investigate.
Start by asking a few pointed questions to find the root cause:
- Did we change the call-to-action (CTA)? A subtle shift from "Shop Now" to "Learn More" can have a surprisingly big impact on user intent and action.
- Was the creative different this time? Maybe you tried a new video style that didn't grab attention as quickly as your usual graphics.
- Was the link placement less obvious? Even small design tweaks can make a "swipe up" or link sticker harder to spot.
- Did a competitor launch a big campaign? Sometimes, the problem isn't you. External noise can easily distract your audience for a bit.
By isolating the most likely variable, you can form a hypothesis and test it with your next post. This is what turning data into real-world action looks like. For a deeper dive, you can learn more about how to measure social media engagement in our detailed guide.
To help with this diagnostic process, I've put together a table that breaks down a few common scenarios you might encounter. Think of it as a quick-reference guide for troubleshooting your performance.
Interpreting Social Media Performance Scenarios
| Scenario (The Data Shows…) | Potential Meaning | Recommended Action |
|---|---|---|
| High Reach, Low Engagement | Your content is being seen by a broad, but untargeted, audience. It lacks a strong hook to inspire interaction. | Refine your audience targeting. Focus on creating more niche, value-driven content that speaks directly to your ideal customer. |
| High Clicks, Low Conversions | The ad or post is compelling, but the landing page isn't delivering on the promise or is confusing. | Review the user experience on your landing page. Ensure messaging consistency between the ad and the page, and check page load speed. |
| High Engagement, Low Reach | You're creating great content for a small, loyal audience, but the platform's algorithm isn't showing it to new people. | Experiment with different formats (like Reels or video). Encourage sharing and consider putting a small ad spend behind your top-performing posts. |
| Low Impressions, Low Everything | Your content is either not being posted at the right time, isn't resonating, or isn't being prioritized by the algorithm. | Revisit your audience research to confirm when they are most active. Test new content pillars and formats to see what gets traction. |
This table isn’t exhaustive, but it’s a solid starting point for connecting the dots between what the data says and what you should do next.
From Numbers to Narratives
When it's time to report to stakeholders or your boss, a spreadsheet full of metrics is the fastest way to make their eyes glaze over. You need to tell a story.
A simple but incredibly effective framework for this is "What, So What, Now What."
- What? State the key finding, plain and simple. (e.g., "Our video content on Facebook received 50% more shares than static images this month.")
- So What? Explain what this actually means for the business. ("This tells us our Facebook audience is far more likely to share content that tells a story or teaches them something.")
- Now What? Propose a clear, specific action plan. ("Based on this, we're reallocating 20% of our creative budget to produce two more educational videos for next month's campaign.")
This simple shift transforms your report from a passive summary into a strategic document. It proves you not only see the numbers but also understand how to use them to move the business forward.
It also pays to understand the context of the platform you're on. Facebook, for instance, still boasts over 3.065 billion monthly active users, with the 25-34 age group as its largest demographic. Knowing this helps you tailor your content strategy. If your audience is there, you know you have a huge potential pool to draw from.
Proving Your Worth: How to Calculate Social Media ROI
This is the moment of truth. Connecting your social media efforts directly to the bottom line is how you prove your strategy is working. Calculating your social media Return on Investment (ROI) might sound intimidating, but it’s the most powerful way to translate likes and shares into a language every executive understands: profit.
The basic formula is actually pretty simple. You take the total value you generated, subtract what you spent, divide that by your total investment, and then multiply by 100. The result is a percentage that shows exactly how much you earned for every dollar you put in.
First, Figure Out What a "Win" is Worth
The real challenge isn't the math—it's putting a dollar value on your social media conversions. Not every goal is a direct sale, so you have to dig a little deeper to see the financial impact.
Here’s how I’ve learned to assign value to different outcomes:
- Lifetime Value (LTV): If a new customer from a LinkedIn campaign has an average LTV of $1,500, that’s your value for that conversion. Simple as that.
- Average Sale Value: For an e-commerce store, maybe the average order from an Instagram bio link is $85. Each of those clicks that converts is worth $85.
- Lead Value: This one requires a bit of collaboration. If your sales team tells you they close 10% of social media leads, and the average deal is worth $5,000, then you can calculate that each lead you send them is worth $500.
Pinning your metrics to real business numbers like these completely changes the conversation. You’re no longer talking about fuzzy concepts like "awareness"; you're talking about tangible revenue.
Don't Forget to Tally Up Your Costs
To get a true ROI, you have to be honest about every single cost. It’s never just about the ad spend.
Make sure your total investment includes:
- Ad Spend: The most obvious one—what you paid for the ads.
- Tool Subscriptions: Don't forget the monthly fees for your scheduling, analytics, or listening software.
- Content Creation: Did you hire a photographer? Pay a freelancer to write copy? Those costs count.
- Team Time: This is the one most people miss. Calculate the prorated salaries or hourly rates for everyone involved in the campaign.
Once you have your total return and your total investment, plugging them into the formula is easy. For a more detailed walkthrough, check out our full guide on social media ROI.
Let's See it in Action
Imagine you spent $1,000 on a campaign (all-in). That campaign brought in 20 qualified leads. Based on your talk with sales, you know each lead is worth about $500.Your total return is $10,000 (20 leads x $500).
Your ROI is (($10,000 – $1,000) / $1,000) * 100 = 900%.
Walking into a meeting with a clear, positive ROI like 900% is the ultimate way to demonstrate your strategy’s value. It’s also worth remembering that a strong social presence has benefits beyond direct sales; it’s a key part of your brand’s public image. It's important to understand how online reputation management drives revenue for small businesses because it’s a powerful, if indirect, benefit of the work you’re doing.
Answering Your Top Social Media Measurement Questions

Once you get past the basic definitions, the real questions about measuring social media start to pop up. It’s one thing to know what a KPI is, but it's another thing entirely to build a workflow around tracking and analyzing it week after week.
Let's dig into some of the most common hurdles I see teams face when they get serious about performance tracking. These are the practical, in-the-weeds challenges that can truly make or break a strategy.
How Often Should I Actually Be Reporting on Social Media Performance?
Finding the right reporting cadence is a balancing act. You need to stay on top of things without drowning your team (or yourself) in data. There's no single magic number, but I've found a three-tiered approach works for almost everyone.
Think of it like this:
- Weekly Check-ins: These are your quick, tactical pulse-checks, especially if you're running active campaigns. A brief look at metrics like ad spend, click-through rates (CTR), and recent engagement lets you make smart adjustments on the fly. This isn't about deep analysis; it's about spotting and fixing problems early.
- Monthly Reports: This is the industry standard for a reason. A month provides enough data to see real trends emerge and measure performance against your goals. This is where you craft the narrative of what worked, what flopped, and what you learned from it.
- Quarterly Reviews: Time to zoom out. Quarterly reports are for the big-picture conversations. You’ll review progress against broader business objectives and use the insights to make significant strategic decisions for the next 90 days.
Sticking to a consistent rhythm is what turns data into a story of progress you can track over time.
What Are the Best Free Tools for Measuring Social Media?
You can get incredibly far without spending a dollar on fancy analytics software. The trick is knowing how to piece together a few powerful free resources to get a complete picture.
Your first stop should always be the native analytics built right into each platform. Seriously, don't overlook them. Tools like Meta Business Suite, LinkedIn Analytics, and TikTok Analytics are packed with granular data you simply can't find anywhere else.
The real power move is connecting those platform insights to what happens next. That's where Google Analytics 4 comes in. It's the essential free tool for tracking the user journey after they click a link in your post and land on your website.
To bridge that gap, use Google's free Campaign URL Builder. This tool creates UTM links—special URLs that tell Google Analytics exactly which post, campaign, or platform drove the traffic. Combining these three gives you a rock-solid, zero-cost foundation for proving your social media ROI.
How Do I Even Begin to Measure a Brand Awareness Campaign?
Measuring brand awareness can feel a bit like trying to measure fog, but it's absolutely doable if you track the right KPIs. You just have to shift your mindset away from direct-response metrics (like sales or leads) and focus on indicators of visibility and perception.
Here’s what to zero in on:
- Reach: The number of unique people who saw your content.
- Impressions: The total number of times your content was shown.
- Share of Voice: A comparison of your brand's mentions versus your top competitors.
Beyond that, look for growth in branded search queries using Google Search Console and keep a close eye on your audience growth and video completion rates. While these don't carry an immediate dollar value, showing consistent upward trends is undeniable proof that your brand is capturing more attention.
Ready to take the guesswork out of your influencer campaigns? REACH provides the advanced discovery tools and real-time analytics you need to find the perfect partners and prove your ROI. Find and manage top influencers with REACH.
