

In today's data-driven landscape, marketing success hinges on more than just execution—it demands constant measurement, analysis, and optimization. Juggling data from social media, ad platforms, SEO tools, and CRMs can feel like trying to solve a puzzle in the dark. This is where marketing dashboard tools become essential. They transform chaotic spreadsheets and disconnected metrics into a single, cohesive view of your performance, enabling you to track KPIs in real-time, identify trends, and make smarter decisions faster.
This guide cuts through the noise to analyze the 12 most effective marketing dashboard tools available today. We move beyond generic feature lists to provide a comprehensive breakdown of each platform's specific strengths, ideal use cases, and practical limitations. For a deeper dive into financial accountability, it’s essential to understand how to measure marketing ROI accurately, a key metric often displayed on these dashboards.
Our goal is to help you find the perfect fit for your agency, in-house brand team, or small business. Each review includes screenshots and direct links, giving you a clear, honest look at tools like REACH, Looker Studio, Tableau, and Databox. Whether you need a simple, plug-and-play solution or a powerful business intelligence platform, you'll find an option here tailored to your unique marketing challenges and technical capabilities. We provide the insights you need to stop guessing and start visualizing your path to growth.
1. REACH
Best for: Agencies and Brands Scaling Influencer Marketing
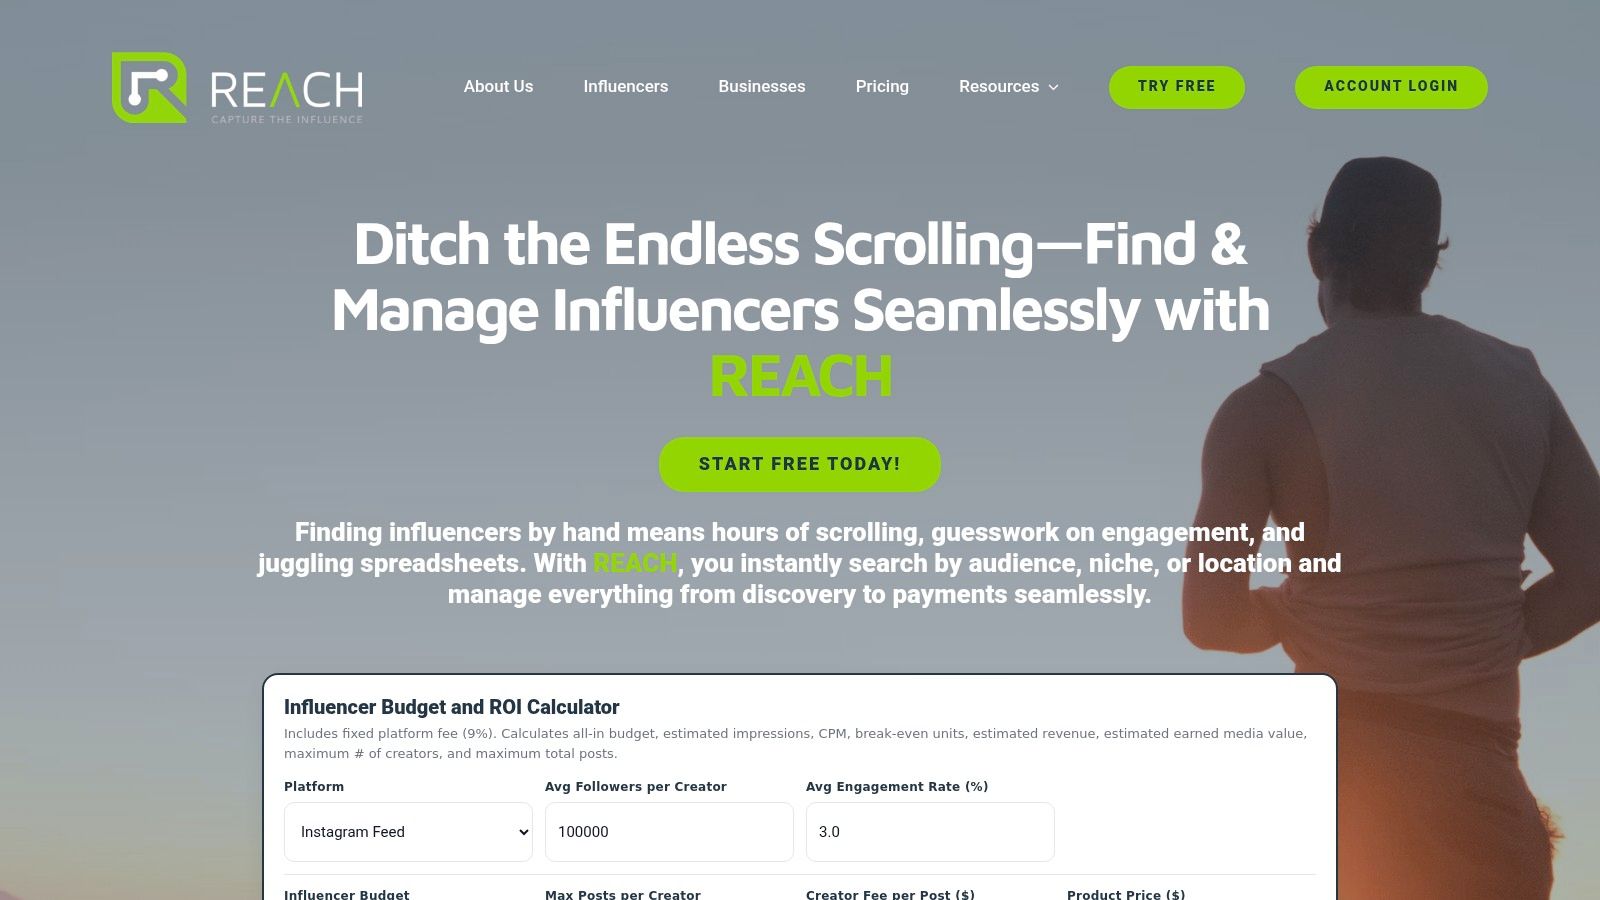
REACH solidifies its position as a premier marketing dashboard tool by offering a highly specialized yet comprehensive platform dedicated to mastering influencer marketing. While many dashboards aggregate data from various channels, REACH distinguishes itself with a laser focus on the entire influencer campaign lifecycle, from discovery to final payment. It provides a centralized command center that eliminates the fragmented, spreadsheet-heavy workflows that often plague influencer collaborations.
For agencies and brands, the platform’s real power lies in its ability to translate influencer activities into measurable business outcomes. Instead of guessing the impact of a campaign, users can track granular metrics in real time, directly connecting influencer content to clicks, conversions, and tangible ROI. This makes it an indispensable tool for teams that need to justify marketing spend and demonstrate success to stakeholders with clear, data-driven reports.
Key Features & Use Cases
REACH moves beyond a simple analytics dashboard by integrating every critical component of campaign management.
- Advanced Influencer Discovery: The platform's discovery engine is a significant advantage. Instead of generic searches, marketers can apply precise filters like engagement rates, audience demographics, and specific content niches to find the perfect creator partners. This is ideal for brands in specialized markets needing to connect with authentic micro or nano-influencers who have highly engaged, targeted followings.
- Centralized Campaign Hub: Users can manage outreach, negotiate contracts, approve content, and process payments all within one interface. This centralized workflow is a core strength, preventing miscommunications and ensuring every step of the campaign is documented and streamlined. The platform's capabilities as a comprehensive campaign management software are a key reason it stands out.
- White-Label Reporting for Agencies: Agencies can generate live, white-labeled reports to share with clients. This feature enhances professionalism and transparency, allowing clients to see campaign performance as it happens, fostering trust and proving the agency's value.
- Integrated Payments & Compliance: Handling payments and tax compliance for multiple influencers can be a logistical nightmare. REACH automates this process, ensuring creators are paid quickly and securely while handling necessary tax documentation, a crucial feature for maintaining positive influencer relationships and operational efficiency.
Pricing
REACH operates on a straightforward model with a fixed 9% platform fee on campaign budgets. This structure is transparent and helps with budget planning, though it's important to note that detailed pricing tiers are not publicly listed and may require a direct sales inquiry for a full breakdown.
Pros & Cons
| Pros | Cons |
|---|---|
| Niche-Specific Discovery: Powerful engine to find highly relevant influencers quickly. | Fixed Fee Structure: The 9% fee may be a significant cost for very large campaign budgets. |
| All-in-One Dashboard: Consolidates all campaign tasks from outreach to analytics. | Pricing Transparency: Requires contacting sales for full cost details, which can slow evaluation. |
| Agency-Focused Features: White-labeling and unlimited client projects support scalability. | |
| Real-Time ROI Tracking: Live analytics and click tracking provide clear performance data. | |
| Secure Payment System: Built-in payments and tax compliance simplify financial operations. |
Learn more at: https://reach-influencers.com
2. Google Looker Studio
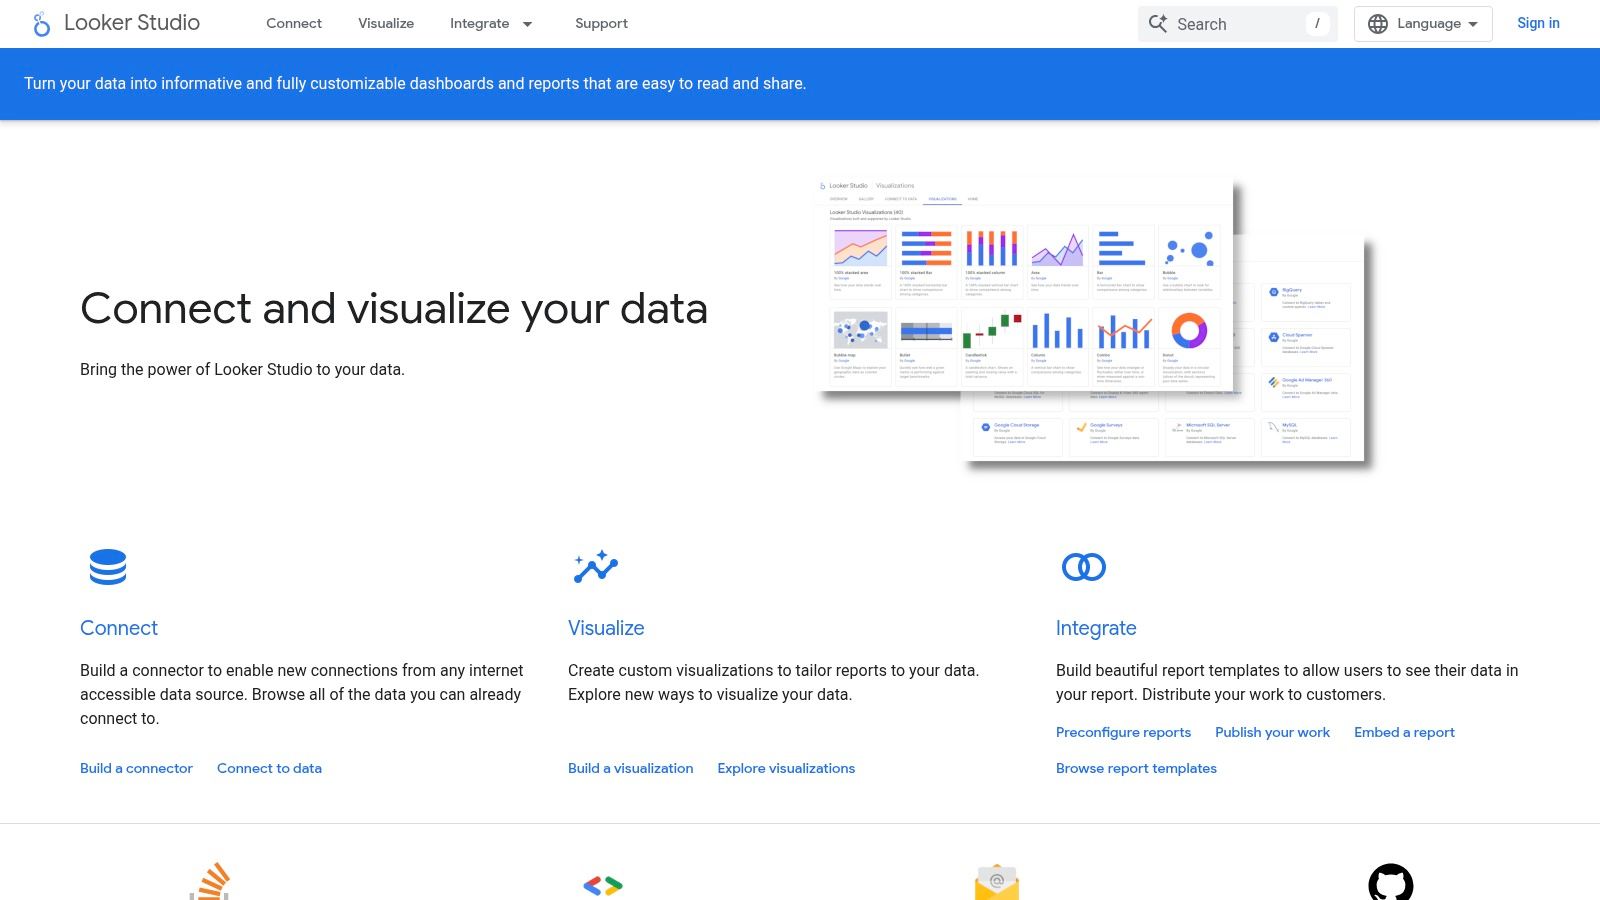
Google Looker Studio (formerly Data Studio) is an indispensable, free marketing dashboard tool for any team deeply invested in the Google ecosystem. Its primary strength lies in its seamless, native integration with platforms like Google Analytics 4, Google Ads, and Search Console, allowing marketers to visualize their core performance data in minutes, not hours.
The platform's browser-based interface is intuitive, featuring a drag-and-drop report builder that feels familiar to anyone who has used Google Slides. This makes it exceptionally accessible for marketers who aren't data engineers but need to create comprehensive reports.
Key Features & Use Cases
What truly sets Looker Studio apart is its extensibility. Beyond native Google connections, it boasts a vast library of over 600 partner and community-built connectors. This allows you to pull in data from social media platforms, CRM systems, and various SEO tools to create a more holistic view of your marketing efforts.
Practical Use Case: An in-house brand team can build a real-time "Source of Truth" dashboard. This dashboard can combine Google Ads cost data, GA4 conversion metrics, and organic traffic from Search Console. By embedding this live report into a company wiki or sharing a link, the entire team stays aligned on performance without needing manual report creation.
Pricing and Limitations
The core version of Looker Studio is completely free, making it one of the most powerful no-cost options available. However, for larger organizations needing advanced governance, team management features, and service level agreements (SLAs), there is a Looker Studio Pro version. This paid tier is part of the Google Cloud platform, and its pricing is not public; it requires direct contact with Google's sales team.
A significant limitation arises when handling high-volume data from non-Google sources. To maintain performance and avoid slow-loading dashboards, you'll likely need to connect Looker Studio to a data warehouse like Google BigQuery, which introduces additional costs and technical complexity.
| Feature | Details |
|---|---|
| Best For | SMBs, agencies, and teams heavily reliant on the Google marketing stack. |
| Core Product Pricing | Free |
| Enterprise Version | Looker Studio Pro (Custom pricing via Google Cloud Sales) |
| Primary Strength | Native integration with Google products and a massive connector ecosystem. |
| Implementation Note | For large datasets, plan to use a data warehouse like BigQuery. |
Website: https://developers.google.com/looker-studio
3. Looker (Google Cloud)
Looker is an enterprise-grade business intelligence (BI) platform designed for organizations that need a governed, scalable approach to data analytics. Unlike more straightforward marketing dashboard tools, Looker’s core strength is its powerful semantic modeling layer, LookML. This allows data teams to define business metrics and logic centrally, ensuring that everyone from the marketing analyst to the CEO is looking at the same trusted numbers.
The platform is built to sit on top of modern cloud data warehouses like BigQuery, Snowflake, or Redshift, transforming raw data into reliable, interactive dashboards. This architecture makes it ideal for large agencies or multi-brand companies that need to manage complex datasets and user permissions securely.
Key Features & Use Cases
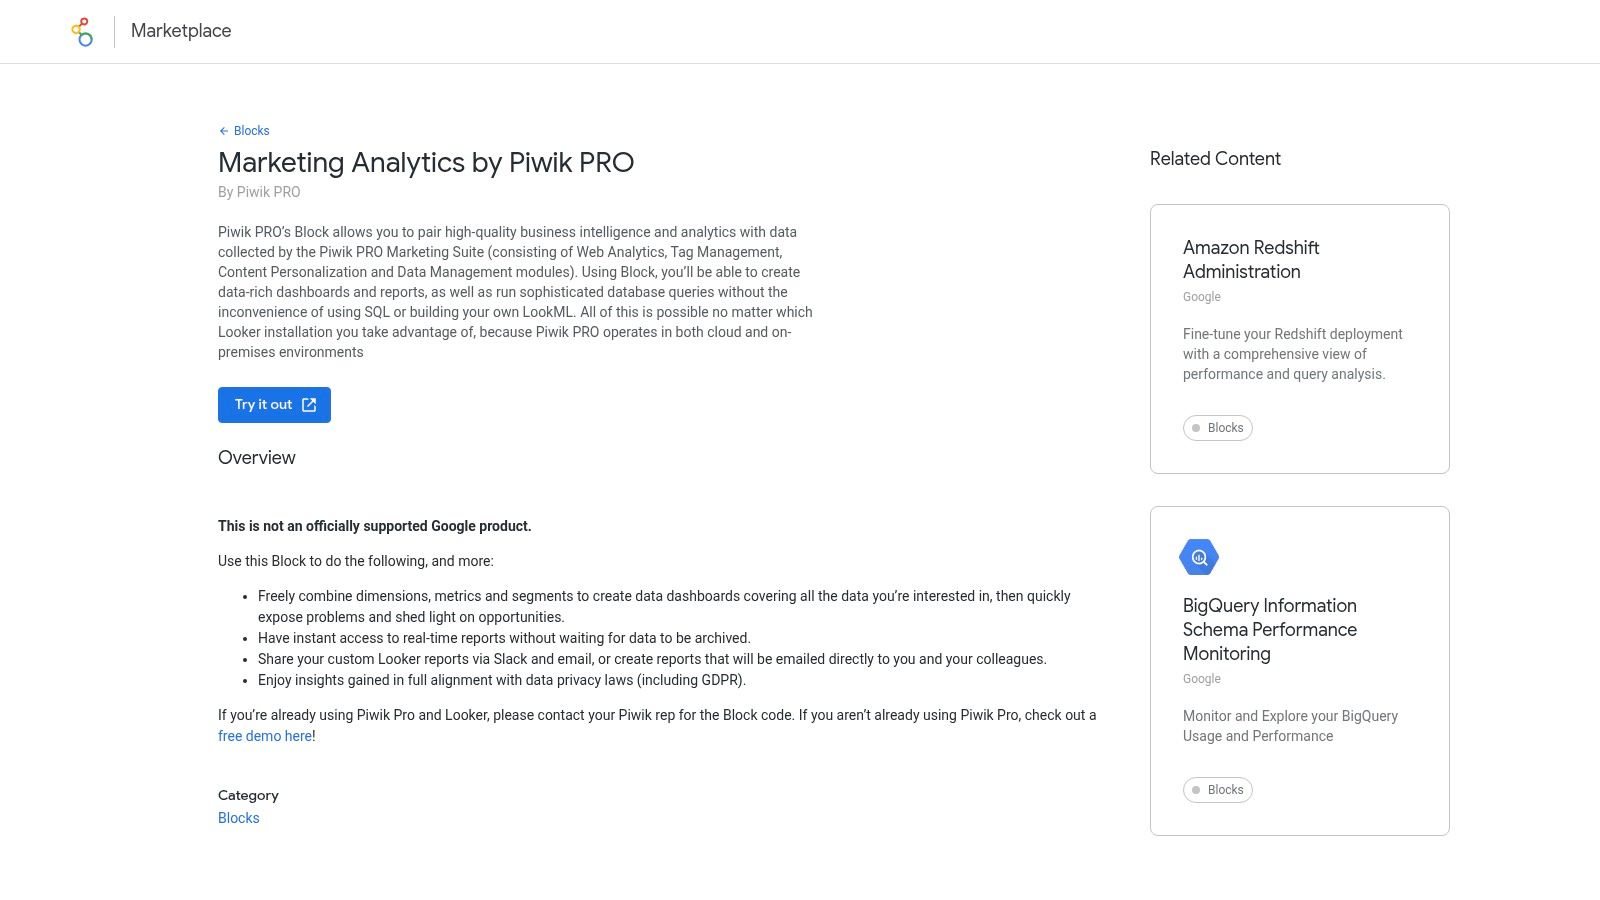
Looker’s primary differentiator is LookML, which acts as a single source of truth for all business metrics. Once defined, these metrics can be explored by business users in a self-service environment without writing SQL. It also offers advanced embedding capabilities and a rich marketplace with pre-built "Blocks" for specific use cases, including marketing analytics.
Practical Use Case: A large digital marketing agency can use Looker to create a secure, multi-tenant client portal. Using the LookML layer, they can define universal metrics like "Cost Per Acquisition" or "ROAS" that apply across all clients. They can then build and embed customized dashboards into their portal for each client, controlling data access so clients only see their own performance, ensuring consistency and governance at scale.
Pricing and Limitations
Looker's pricing is not publicly listed and is quote-based, requiring direct engagement with Google Cloud's sales team or a certified partner. It is positioned as a premium, enterprise solution, and its cost reflects that. The total investment must also account for the underlying cloud data warehouse, which is a prerequisite for using Looker effectively.
The main limitation is the significant upfront technical investment. It is not a plug-and-play tool; it requires data modeling expertise to set up the LookML layer. This technical barrier makes it less suitable for smaller teams or those without dedicated data engineering resources.
| Feature | Details |
|---|---|
| Best For | Large enterprises, data-mature agencies, and companies needing strong governance. |
| Core Product Pricing | Quote-based (Contact Google Cloud Sales) |
| Enterprise Version | All versions are enterprise-focused. |
| Primary Strength | Centralized data modeling (LookML) for governed, scalable analytics. |
| Implementation Note | Requires a cloud data warehouse and dedicated data modeling resources. |
Website: https://marketplace.looker.com/marketplace/detail/marketing-analytics-by-piwik-pro?utm_source=openai
4. Tableau
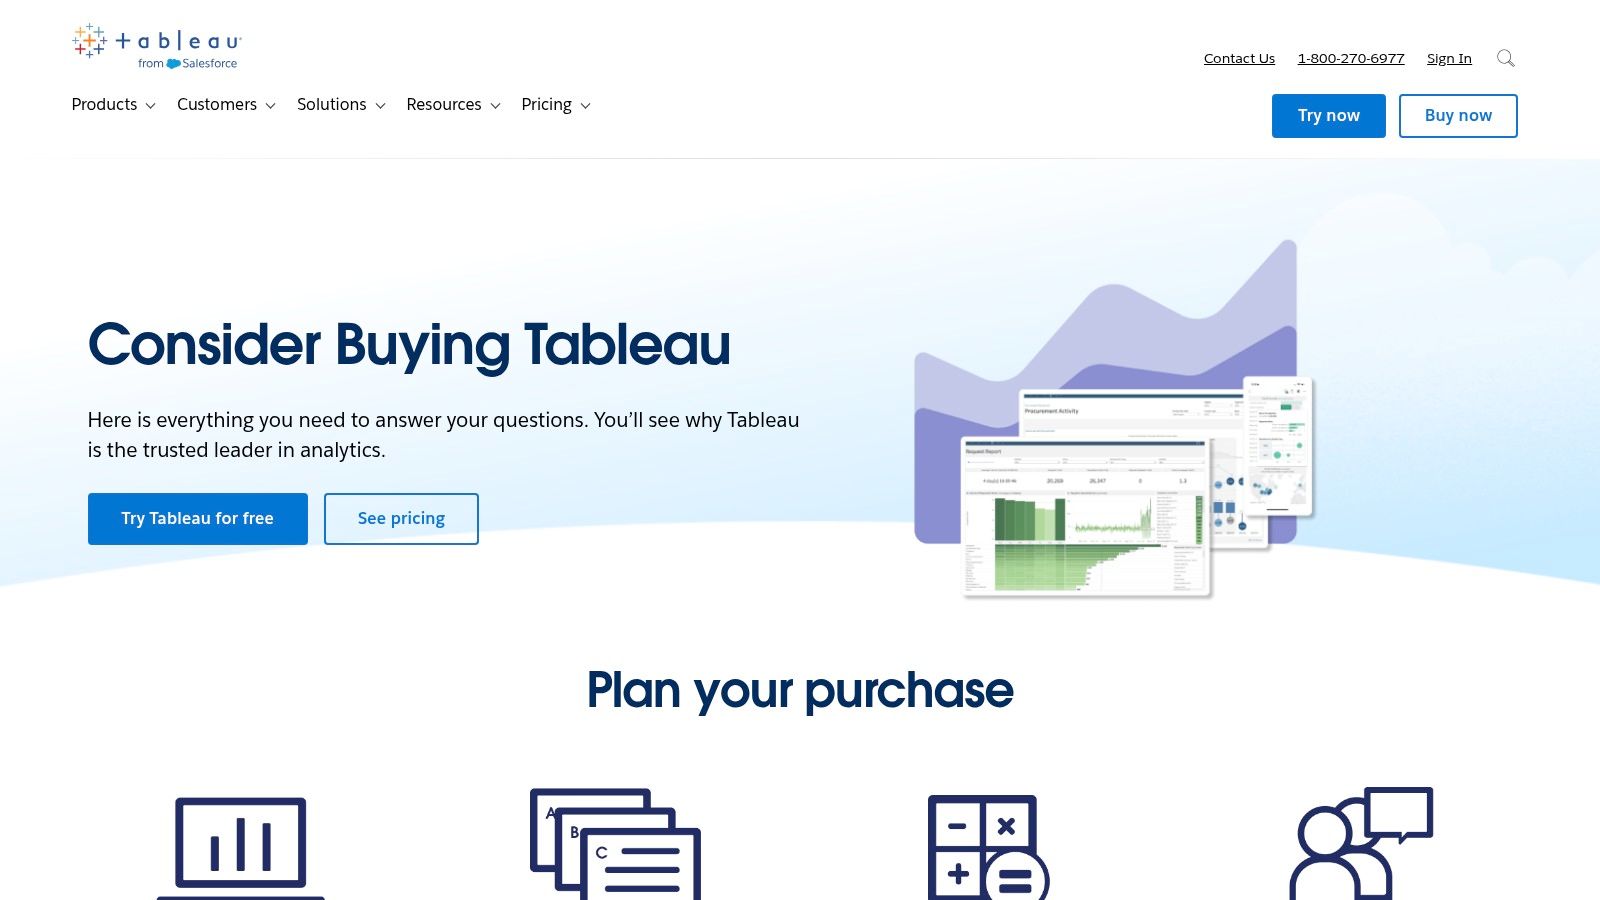
Tableau is a powerhouse in the business intelligence and data visualization space, often favored by larger organizations for creating executive-level marketing dashboards. Its strength lies in its ability to transform complex datasets into rich, interactive visualizations that facilitate deep analysis and data storytelling. It is a mature platform with both cloud-hosted and on-premise server options.
The platform's desktop application, Tableau Desktop, is where the bulk of dashboard creation occurs, offering immense power and flexibility for data analysts. This allows for sophisticated data blending and the creation of highly polished, interactive reports that can be published to Tableau Cloud or Server for broader team access.
Key Features & Use Cases
Tableau's user licensing model (Creator, Explorer, Viewer) is designed to provide role-based access to data, which is crucial for governance in large marketing departments. Creators build the data sources and dashboards, Explorers can analyze existing data and create new workbooks from templates, and Viewers can interact with published dashboards. This structure ensures data integrity while empowering users.
Practical Use Case: A CMO needs a high-level view of marketing's impact on revenue. A data analyst can use Tableau to blend Salesforce CRM data with Marketo automation stats and Google Ads performance. The resulting dashboard, published to Tableau Cloud, allows the CMO to filter by region, campaign, or time period to understand ROI without needing to ask for new reports.
Pricing and Limitations
Tableau’s pricing is user-based and billed annually, making it a significant investment. Tableau Creator licenses, which include the desktop application, start at $75 per user/month. Explorer and Viewer licenses are less expensive, intended for users who primarily consume or lightly edit existing reports.
The platform's primary limitation for marketing teams without dedicated data support is its learning curve and the need for data preparation. To get the most out of Tableau, data often needs to be cleaned and structured in a separate tool or a data warehouse beforehand. Furthermore, its reliance on a desktop application for authoring can be less collaborative than purely cloud-based marketing dashboard tools.
| Feature | Details |
|---|---|
| Best For | Enterprise marketing teams and organizations with dedicated data analysts. |
| Core Product Pricing | Starts at $75/user/month (Creator license), billed annually. |
| Enterprise Version | Core product is enterprise-grade; custom pricing for large deployments. |
| Primary Strength | Powerful data visualization, storytelling, and enterprise-level governance. |
| Implementation Note | Expect to invest in data preparation and user training for best results. |
Website: https://www.tableau.com/pricing/consider-buying-tableau?utm_source=openai
5. Microsoft Power BI
Microsoft Power BI is a dominant force in the business intelligence world, offering a powerful suite of marketing dashboard tools for organizations embedded in the Microsoft ecosystem. Its greatest advantage is the deep integration with products like Excel, Azure, and Microsoft Fabric, allowing for sophisticated data modeling and enterprise-grade reporting directly within a familiar environment.
The platform consists of a desktop application (Power BI Desktop) for report creation and a cloud service for sharing and collaboration. This two-part structure allows for complex data transformation and modeling offline before publishing polished, interactive dashboards for stakeholders.
Key Features & Use Cases
Power BI excels with its extensive library of pre-built connectors and custom visuals, giving marketers immense flexibility. Advanced features like row-level security and governance, managed through Microsoft 365, make it a secure choice for enterprises needing to control data access across different teams and roles.
Practical Use Case: A large e-commerce company can use Power BI to consolidate sales data from its ERP, ad spend from various platforms (via connectors), and website behavior from its analytics tool. They can build a central marketing performance dashboard that tracks key digital marketing performance metrics and provides C-level executives with a high-level view, while regional managers can only see data relevant to their specific market, all from the same report.
Pricing and Limitations
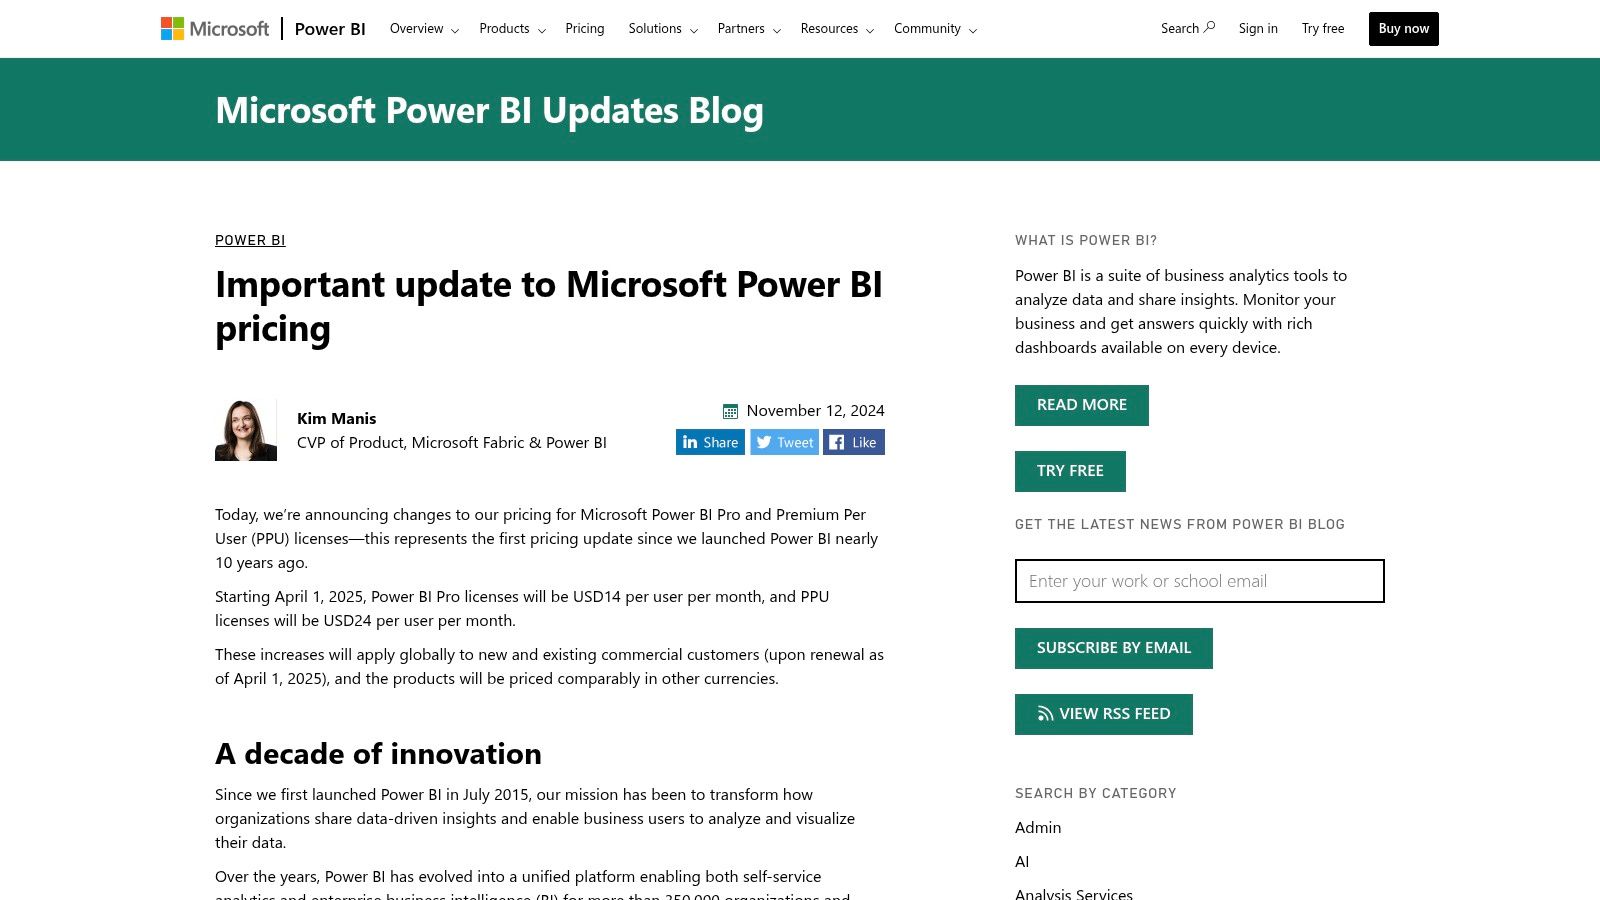
Power BI offers several licensing tiers, starting with a free version for individual use. The Power BI Pro license is required for sharing and collaboration, priced competitively per user per month. Power BI Premium is available on a per-user (PPU) or per-capacity basis, offering larger data capacities and advanced features for enterprise-scale deployments.
The primary limitation is its complexity, especially concerning licensing and sharing. Navigating the differences between Pro, PPU, and capacity licenses can be confusing for new teams. While powerful, the learning curve is steeper than some drag-and-drop-focused tools, particularly its DAX formula language for custom calculations.
| Feature | Details |
|---|---|
| Best For | Enterprises and teams heavily invested in the Microsoft Azure/365 ecosystem. |
| Core Product Pricing | Power BI Pro (per-user, per-month fee) |
| Enterprise Version | Power BI Premium (Per user or per capacity) |
| Primary Strength | Strong enterprise governance, security, and integration with Microsoft tools. |
| Implementation Note | Licensing can be complex; carefully evaluate user needs for sharing vs. viewing. |
6. Databox
Databox is a marketing dashboard tool specifically engineered for speed and simplicity, making it a favorite among marketing agencies and in-house teams who need actionable insights without a steep learning curve. Its core value proposition is its extensive library of pre-built templates and native integrations for platforms like HubSpot, Google Analytics 4, and various social media channels.
This focus on templates allows non-technical marketers to connect their data sources and generate comprehensive, visually appealing dashboards in minutes. Instead of building reports from scratch, users can immediately pull in key metrics, set goals, and track performance against benchmarks.
Key Features & Use Cases
Databox excels with its "plug-and-play" functionality. Features like automated alerts, scorecards for tracking daily KPIs, and a robust mobile app ensure that critical data is always accessible. For agencies, the white-labeling and client access features are particularly powerful, allowing them to deliver branded, professional reports seamlessly. You can learn more about how it stacks up as a social media analytics dashboard.
Practical Use Case: A digital marketing agency can use Databox to create a standardized "Client Performance" template. This template pulls data from Google Ads, Facebook Ads, and a CRM like HubSpot. Each new client can be set up with this dashboard in under an hour, providing them with a branded, real-time portal to view their campaign results, significantly reducing manual reporting time.
Pricing and Limitations
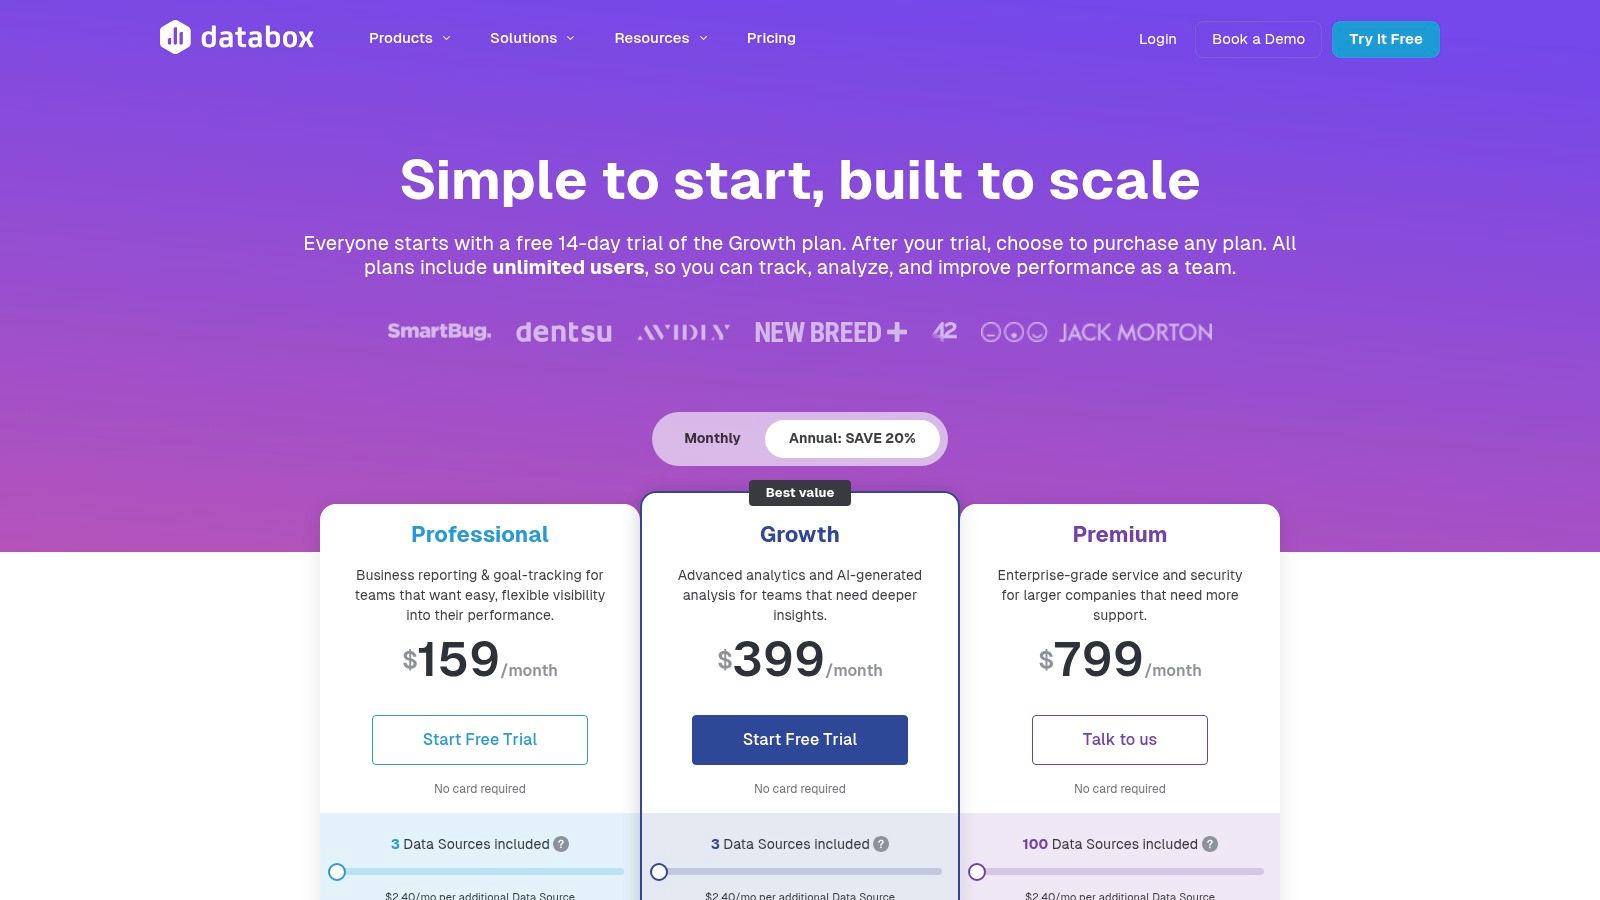
Databox has shifted its model, and its Free and Starter plans are being sunset in early 2025, moving it to a fully paid platform. Plans are now tiered based on the number of data connections and dashboards needed. Pricing is available for individuals, businesses, and agencies, with the latter offering features for managing multiple clients.
The primary limitation is its focus on pre-built connectors. While it covers most major marketing platforms, it lacks the flexibility of tools like Looker Studio for connecting to custom databases or obscure data sources without relying on third-party integrations like Zapier, which can add complexity and cost.
| Feature | Details |
|---|---|
| Best For | Marketing agencies and SMBs needing fast, template-driven reporting. |
| Core Product Pricing | Paid plans only (Free/Starter tiers sunsetting in 2025). |
| Enterprise Version | Agency and custom plans available with white-labeling. |
| Primary Strength | Huge library of pre-built templates and native marketing integrations. |
| Implementation Note | Ideal for standard marketing data; less flexible for custom data sources. |
Website: https://databox.com/pricing-agency?utm_source=openai
7. Klipfolio (PowerMetrics/Klips)
Klipfolio is a versatile, cloud-based business intelligence platform that excels at creating powerful marketing dashboards for teams and agencies. It offers two core products: PowerMetrics for streamlined metric tracking and Klips for building highly customized, pixel-perfect dashboards. This flexibility makes it a strong choice for organizations with diverse reporting needs.
The platform is particularly favored by agencies due to its robust white-labeling and client management features. It enables teams to create branded, real-time reports that can be easily shared via public links, scheduled PDFs, or even displayed on office TVs using its dedicated TV mode.
Key Features & Use Cases
With over 130 pre-built data integrations, Klipfolio simplifies the process of connecting to marketing channels like social media, advertising platforms, and analytics tools. Its strength lies in its ability to handle near-real-time data refreshes, ensuring that dashboards reflect the latest performance metrics without manual intervention.
Practical Use Case: A digital marketing agency can use Klipfolio to build a standardized, white-labeled client performance dashboard. This template can pull data from Google Ads, Facebook Ads, and GA4. Using published links and user permissions, they can give each client secure access to their own live dashboard, enhancing transparency and reducing the time spent on manual reporting.
Pricing and Limitations
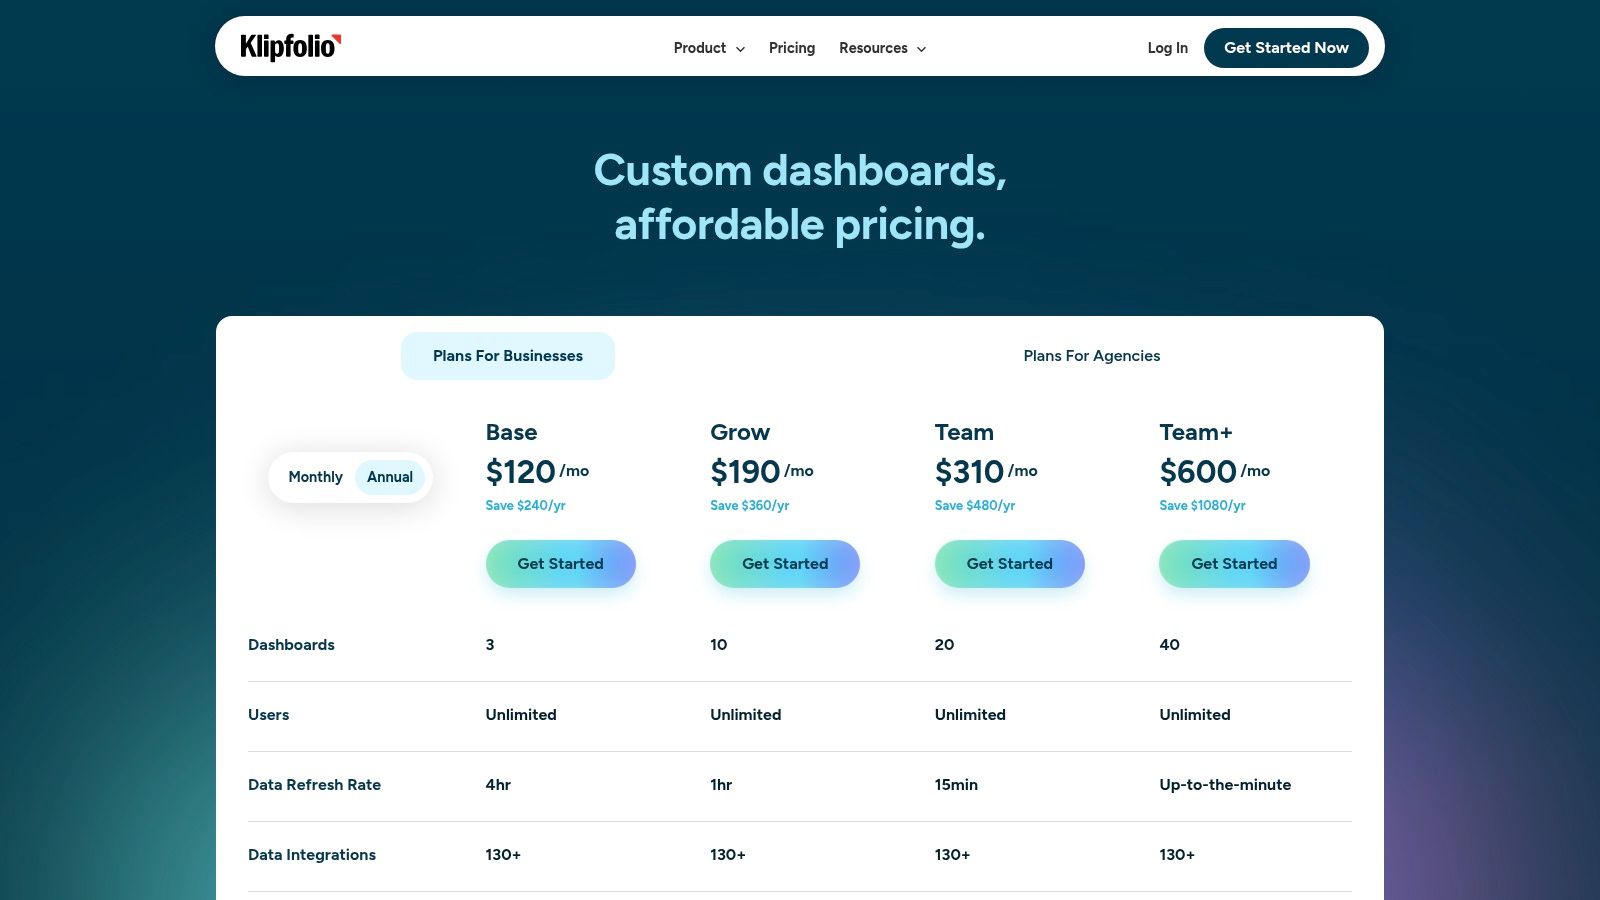
Klipfolio offers a multi-tiered pricing model. A Free plan is available for up to two users and provides basic metric tracking. Paid plans start with the Go tier at $125/month, which includes more users, dashboards, and faster data refresh rates. Higher-tier plans like Pro and Business unlock advanced features, including add-ons for SSO, domain aliasing, and white-labeling.
While Klipfolio is powerful for visualization, its advanced data modeling and formula editor can present a steeper learning curve for non-technical marketers. Users aiming for complex data manipulations may need to invest time in learning the platform's specific syntax and functions, which is more involved than simpler drag-and-drop tools.
| Feature | Details |
|---|---|
| Best For | Marketing agencies and data-driven teams needing white-labeling and customization. |
| Core Product Pricing | Free plan available. Paid plans start at $125/month (Go Plan). |
| Enterprise Version | Custom Business plans with add-ons for SSO, white-labeling, and more. |
| Primary Strength | Flexible sharing options (TV mode, published links) and strong agency features. |
| Implementation Note | Be prepared for a learning curve with the advanced data modeling features. |
Website: https://www.klipfolio.com/pricing
8. Geckoboard
Geckoboard is a marketing dashboard tool purpose-built for high-visibility, real-time monitoring, especially on large TV screens. Its core philosophy revolves around making key performance indicators (KPIs) easily digestible for entire teams at a glance. The platform excels at creating clean, visually appealing dashboards that are simple to deploy and maintain.
The interface is streamlined for speed, allowing users to connect to data sources and build widgets in minutes. This focus on simplicity and quick deployment makes it a favorite for teams who need to track live metrics without the steep learning curve associated with more complex business intelligence platforms.
Key Features & Use Cases
With over 90 pre-built integrations, Geckoboard connects easily to popular marketing, sales, and support tools. Its standout feature is the "TV Mode," which automatically optimizes dashboards for large displays and can cycle through multiple dashboards on a loop. This is complemented by sharing features like Slack snapshots and email reports to keep stakeholders informed.
Practical Use Case: A B2B marketing team can display a live dashboard on an office TV showing website traffic from Google Analytics, new leads from Salesforce, and social media engagement from Sprout Social. This constant visibility keeps the entire team aligned on top-of-funnel performance and motivates them by showcasing the immediate impact of their campaigns.
Pricing and Limitations
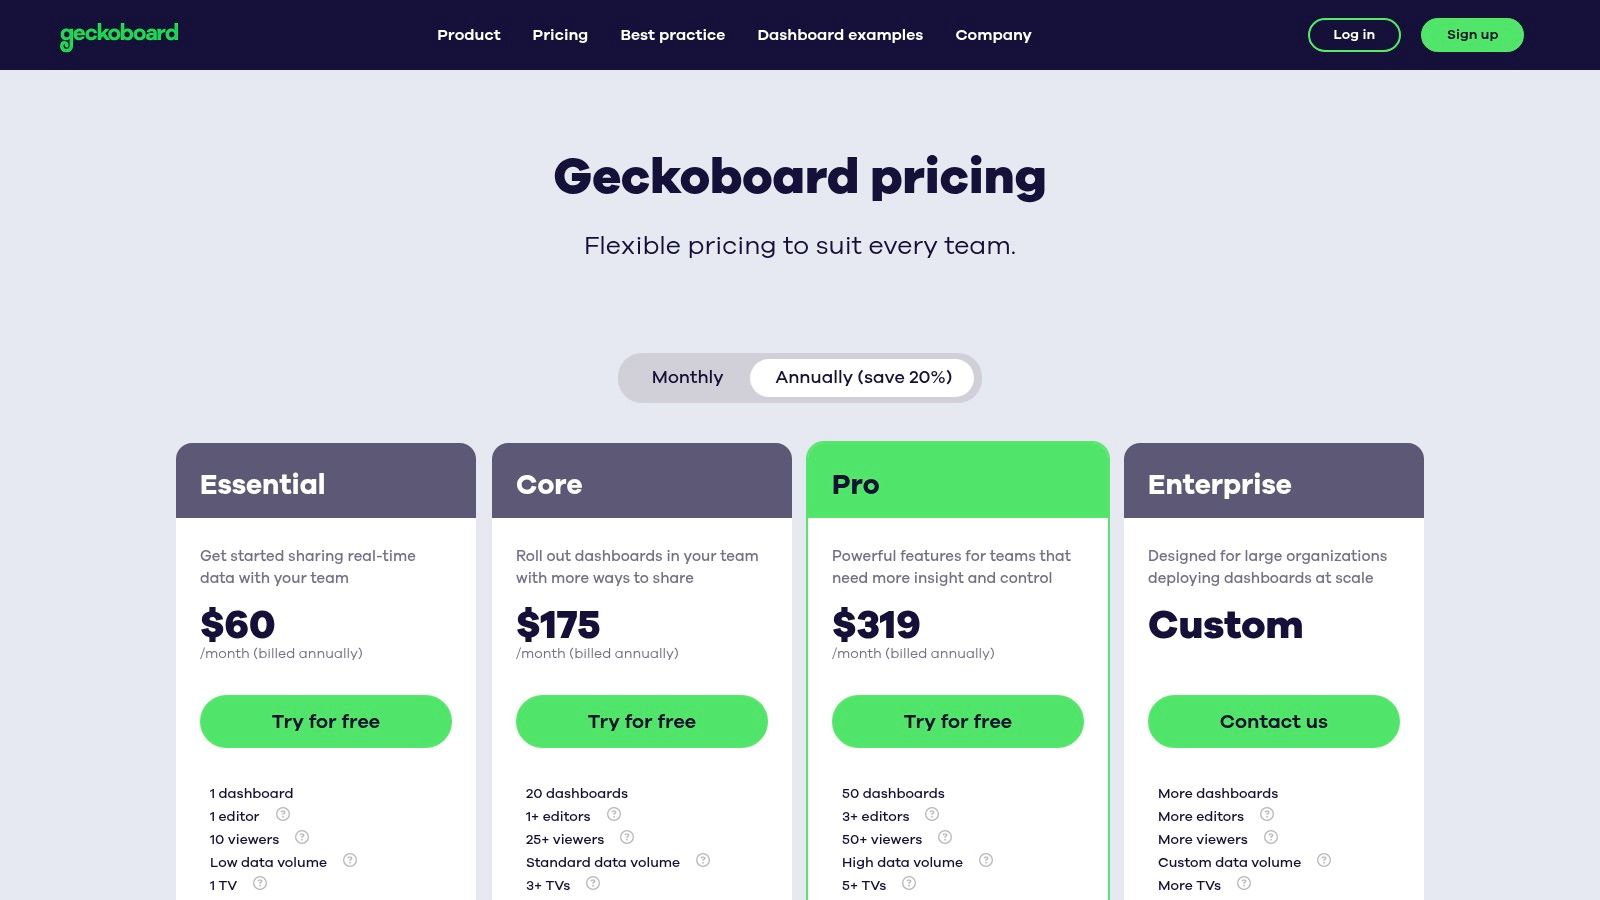
Geckoboard offers several paid tiers, starting with the Starter plan at $49/month for one dashboard and two users. The Team plan at $179/month expands this to five dashboards and unlimited users, while the Company plan at $599/month adds features like custom branding and advanced admin controls. A 14-day free trial is available for all plans.
The platform's primary limitation is its intentional simplicity. It is not designed for deep data analysis or complex data modeling. Teams that require advanced data blending, custom queries, or granular drill-downs will find its capabilities restrictive compared to full-featured BI tools.
| Feature | Details |
|---|---|
| Best For | Teams needing highly visible, real-time KPI dashboards for wallboards. |
| Core Product Pricing | Starts at $49/month (Starter Plan) |
| Enterprise Version | Company Plan ($599/month) offers advanced permissions and branding. |
| Primary Strength | Simplicity and speed of deployment, optimized for TV screen display. |
| Implementation Note | Best suited for monitoring, not for in-depth data exploration or analysis. |
Website: https://www.geckoboard.com/pricing/?utm_source=openai
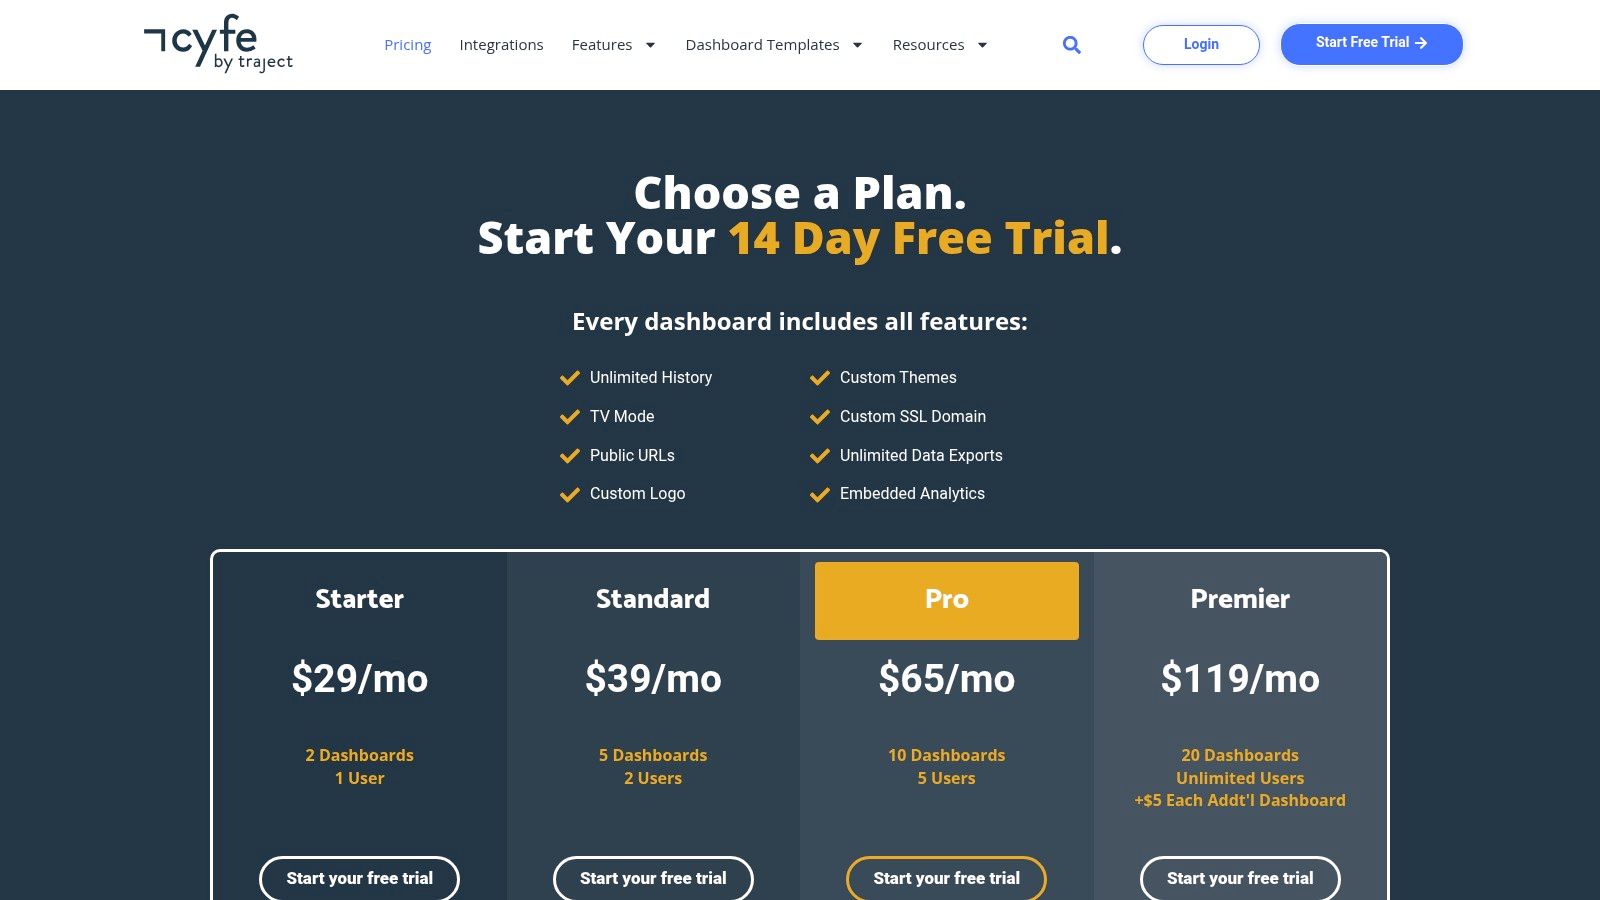
9. Cyfe
Cyfe stands out as an all-in-one marketing dashboard tool that prioritizes simplicity and affordability, making it a strong contender for small businesses and agencies. Its core strength is a massive library of pre-built widgets for social media, advertising, SEO, and web analytics, allowing users to quickly assemble dashboards without extensive technical knowledge.
The platform is designed for ease of use, enabling teams to connect data sources and visualize metrics in minutes. Features like TV Mode, which cycles through dashboards automatically, are perfect for displaying performance data on office screens, while public sharing links simplify client reporting.
Key Features & Use Cases
What makes Cyfe particularly appealing is its generous feature set, even on lower-tier plans. Unlike many competitors, it offers unlimited data history and exports across all paid plans. For agencies, the white-labeling options, custom SSL/domain settings, and embeddable dashboards provide a professional and seamless reporting experience for clients.
Practical Use Case: A small digital marketing agency can use Cyfe to create custom, branded dashboards for each client. By pulling in data from Google Ads, Facebook Insights, and Mailchimp using pre-built widgets, the agency can provide a real-time, consolidated performance view. This report can be shared via a public link, eliminating the need for manual PDF reports and giving clients on-demand access to their campaign data.
Pricing and Limitations
Cyfe's pricing is highly competitive, starting with a free "Starter" plan for one user and one dashboard. Paid plans are budget-friendly, ranging from $19 to $150 per month depending on the number of users and dashboards required. The top-tier "Agency" plan includes full white-labeling capabilities.
The primary limitation of Cyfe is its simplicity. While excellent for straightforward data visualization, it lacks the sophisticated data modeling, blending, and transformation capabilities found in more advanced business intelligence (BI) tools. It is a reporting tool first and a deep data analysis platform second.
| Feature | Details |
|---|---|
| Best For | Small agencies, SMBs, and freelancers needing a simple, affordable tool. |
| Core Product Pricing | Starts at $19/month; Free "Starter" plan available. |
| Enterprise Version | "Agency" plan ($150/month) offers white-labeling and more users. |
| Primary Strength | Wide range of pre-built widgets and excellent value for the price. |
| Implementation Note | Ideal for surface-level reporting, not for complex data analysis. |
Website: https://www.cyfe.com/pricing/?utm_source=openai
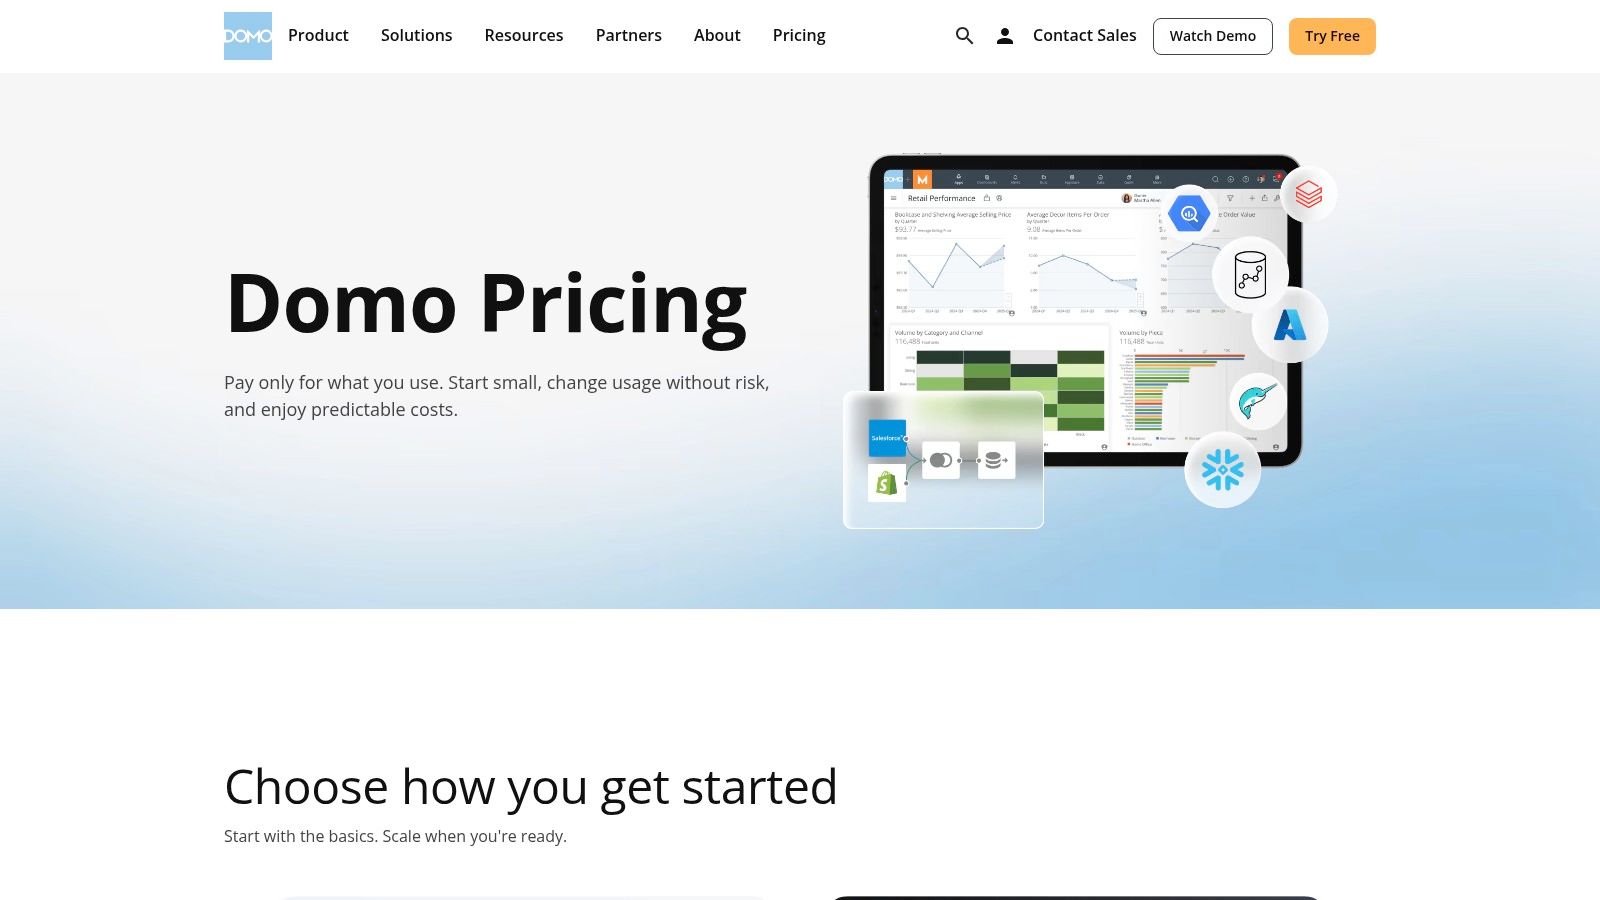
10. Domo
Domo is a comprehensive, cloud-native platform designed for enterprise-level business intelligence, moving well beyond typical marketing dashboard tools. It provides an end-to-end solution that handles everything from data integration with hundreds of connectors and ETL tools to creating interactive visualizations and custom applications. Its strength lies in unifying disparate data sources across an entire organization.
This full-stack approach makes Domo ideal for large marketing teams that need to correlate their campaign performance with broader business KPIs like sales, finance, and operations. The platform is built for governance and scale, offering features like Single Sign-On (SSO) and robust user permission controls suitable for complex enterprise environments.
Key Features & Use Cases
Domo’s extensive feature set includes an App Studio for building custom data-driven applications, embedded analytics for integrating dashboards into other software, and AI-driven features for surfacing insights. This makes it a powerful tool for creating highly tailored data experiences that serve multiple departments.
Practical Use Case: A global enterprise marketing team can use Domo to build a central command center. This dashboard could pull data from Salesforce (CRM), Marketo (automation), Google Ads (paid media), and SAP (finance). By doing so, they can directly map marketing spend and lead generation activities to closed-won revenue, providing C-suite executives with a clear view of marketing's financial impact.
Pricing and Limitations
Domo's pricing is not publicly listed; it is quote-based and tied to consumption metrics like data queries and user count. This model requires engaging with their sales team and is typically positioned for mid-market to enterprise clients. It is generally one of the more expensive options in this category.
The platform's all-in-one nature can also be a limitation. Its complexity and extensive capabilities may present a steep learning curve for smaller teams or those without dedicated data analysts. Implementing Domo is often a significant project, unlike more plug-and-play dashboarding tools.
| Feature | Details |
|---|---|
| Best For | Large enterprises needing a unified, governed BI platform across multiple departments. |
| Core Product Pricing | Custom pricing via sales inquiry; consumption-based model. |
| Enterprise Version | The core product is enterprise-grade. |
| Primary Strength | A complete, end-to-end data stack from integration and ETL to visualization. |
| Implementation Note | Expect a significant implementation process and a steeper learning curve. |
Website: https://www.domo.com/pricing?utm_source=openai
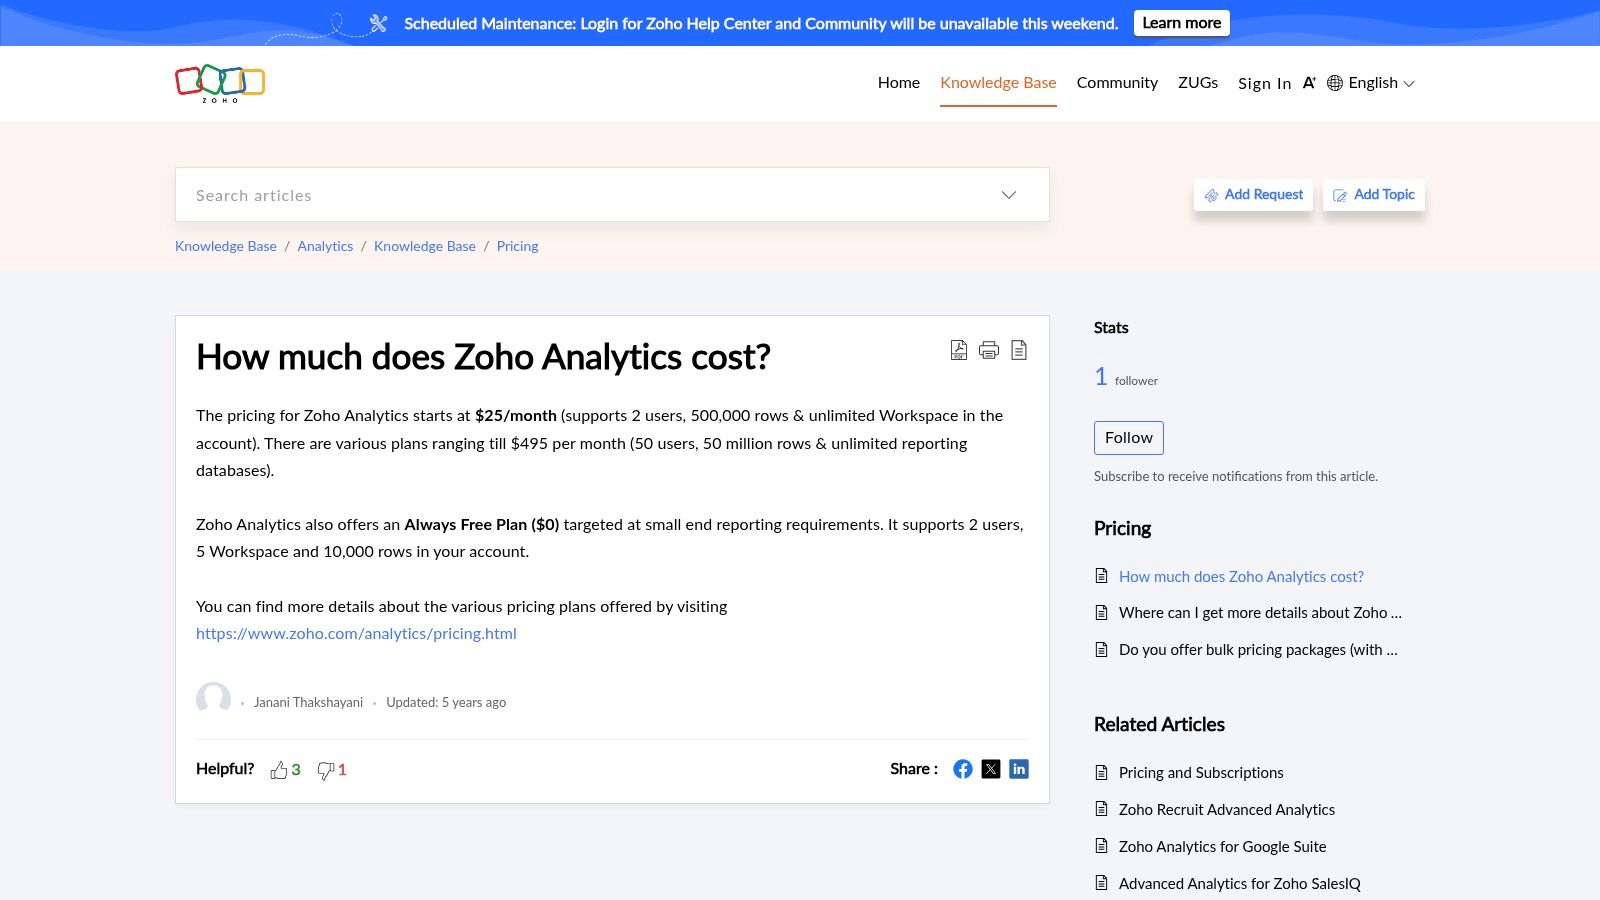
11. Zoho Analytics
Zoho Analytics is a powerful business intelligence and analytics platform that excels for teams already embedded within the Zoho ecosystem. Its key advantage is the deep, native integration with other Zoho products like Zoho CRM and Zoho Campaigns, allowing for a unified view of the entire customer journey from lead acquisition to sale.
Beyond its own suite, Zoho Analytics provides a robust set of connectors for essential marketing platforms, making it a versatile choice. The platform features an intuitive drag-and-drop interface and an AI-powered assistant, Zia, which can answer natural language queries (e.g., "show me conversions by campaign last month") and automatically generate insights. This makes complex data analysis more accessible for non-technical marketers.
Key Features & Use Cases
What distinguishes Zoho Analytics is its combination of comprehensive BI capabilities with user-friendly features. It supports advanced data blending and modeling, allowing marketers to join data from disparate sources like Google Ads, Facebook Ads, and their internal CRM to build a complete performance picture. Dashboards can be securely shared via private links or embedded into company portals.
Practical Use Case: A B2B marketing team using Zoho CRM can create a "Funnel Performance" dashboard in Zoho Analytics. This dashboard can pull lead data directly from the CRM, combine it with campaign cost data from Google Ads, and visualize the cost-per-lead and lead-to-conversion rate by marketing channel, all in one seamless, automated report.
Pricing and Limitations
Zoho Analytics offers very competitive pricing, particularly for SMBs. Plans start with a free option for two users and scale up through several paid tiers, beginning at $24/month (billed annually) for the Basic plan. Higher-tier plans unlock more data capacity, advanced features, and additional users.
The primary limitation is that while powerful, some of the most advanced governance and enterprise-level features are reserved for the more expensive plans. Additionally, while the UI is generally user-friendly, mastering the more complex data modeling and custom formula functions can involve a steeper learning curve compared to simpler visualization tools.
| Feature | Details |
|---|---|
| Best For | Businesses already using the Zoho suite, SMBs looking for a powerful BI tool. |
| Core Product Pricing | Starts at $24/month (billed annually); Free plan available. |
| Enterprise Version | Enterprise plans offer advanced features and scale. |
| Primary Strength | Seamless integration with Zoho products and competitive SMB pricing. |
| Implementation Note | Leverage the native Zoho connectors for the quickest setup and value. |
Website: https://www.zoho.com/analytics/
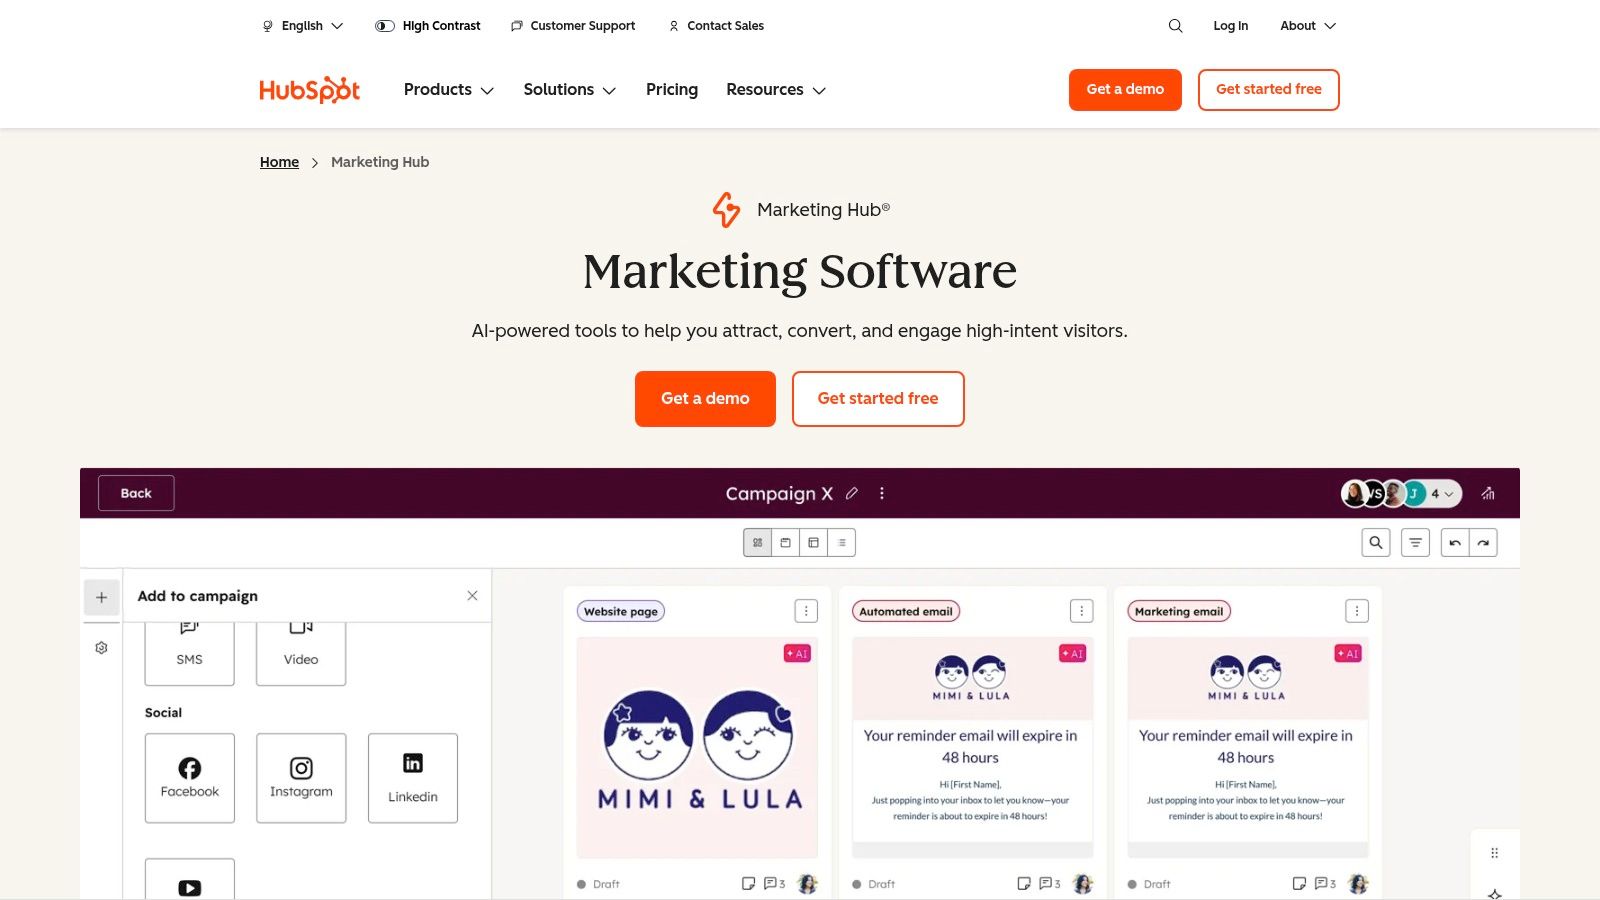
12. HubSpot Marketing Hub (Dashboards & Reporting)
For marketing teams who want their analytics and execution under one roof, HubSpot’s built-in reporting is a compelling option. Instead of connecting a separate business intelligence tool, HubSpot offers pre-built and customizable dashboards that pull data directly from its CRM, email marketing, ad management, and landing page tools. This native integration eliminates data transfer issues and provides an immediate, unified view of the entire customer journey.
The platform is designed for marketers first, with an interface that makes building reports on campaigns, lead sources, and content performance straightforward. It excels at connecting operational activities (like an email send) directly to business outcomes (like new deals closed), which is often a major challenge with disparate tools.
Key Features & Use Cases
What makes HubSpot a powerful marketing dashboard tool is its all-in-one nature. You can track ad performance, web traffic, form submissions, and email engagement in a single dashboard without configuring complex integrations. The Enterprise tier takes this further with sophisticated features like multi-touch revenue attribution, clarifying which marketing channels are truly driving revenue.
Practical Use Case: A B2B marketing team can create a "Lead-to-Revenue" dashboard directly within HubSpot. This dashboard could track MQLs generated from a specific LinkedIn Ads campaign, monitor their conversion through the sales pipeline in the CRM, and ultimately attribute a specific dollar value to that campaign's ROI, all without leaving the platform.
Pricing and Limitations
HubSpot's pricing is tiered, with reporting capabilities scaling significantly with each plan. While a free version exists, meaningful dashboard features begin in the Professional tier. The most advanced reporting, like multi-touch revenue attribution, is locked behind the expensive Enterprise tier. A major consideration is the mandatory onboarding fee for Professional and Enterprise plans, which can be a significant upfront cost.
The primary limitation is that HubSpot's reporting is strongest when you are fully committed to its ecosystem. If your key marketing data lives in external, unsupported tools, you may find its native reporting capabilities restrictive compared to more flexible, dedicated BI platforms.
| Feature | Details |
|---|---|
| Best For | Businesses of all sizes that use HubSpot as their core CRM and marketing platform. |
| Core Product Pricing | Marketing Hub Professional starts at $800/month (billed annually). |
| Enterprise Version | Marketing Hub Enterprise starts at $3,600/month (billed annually). |
| Primary Strength | Seamless integration of reporting with marketing execution and CRM data. |
| Implementation Note | Be prepared for mandatory, paid onboarding for Professional & Enterprise tiers. |
Website: https://www.hubspot.com/products/marketing/professional?utm_source=openai
Top 12 Marketing Dashboard Tools Comparison
| Platform | Core Features / Characteristics | User Experience / Quality ★★★★☆ | Value Proposition 💰 | Target Audience 👥 | Unique Selling Points ✨ | Price Points 💰 |
|---|---|---|---|---|---|---|
| 🏆 REACH | Niche influencer discovery, white-label campaigns, ROI analytics | Centralized dashboard, real-time tracking | Transparent ROI, fixed 9% platform fee | Agencies, Brands, Influencers | Fast payouts, tax compliance, unlimited clients | Fixed 9% fee |
| Google Looker Studio | 600+ connectors, templates, developer framework | Free core, easy sharing | Free core product, large ecosystem | Marketing teams, Analysts | Google native data integration | Free core; Pro: contact sales |
| Looker (Google Cloud) | Semantic layer, embed/permissions, marketing Blocks | Strong governance, scalable for agencies | Enterprise-grade BI | Enterprises, Agencies | Governed metrics, rich extensibility | Quote-based |
| Tableau | Role-based licenses, rich visuals, cloud/server hosting | Mature ecosystem, excellent data storytelling | Broad skill availability | Enterprises, Analysts | Executive dashboards, interactive visuals | Subscription-based |
| Microsoft Power BI | Extensive visuals/connectors, security, flexible licensing | Competitive pricing, MS ecosystem integration | Strong enterprise compliance | Enterprises, Microsoft users | Deep MS 365 integration, row-level security | Pro from $10/user/mo |
| Databox | Prebuilt dashboards, alerts, white-label | Fast time-to-value, mobile support | Agency-friendly branding | Agencies, In-house marketers | Agency branding, goal tracking | Paid tiers only (free ending) |
| Klipfolio (PowerMetrics/Klips) | Real-time data refresh, TV mode, SSO & white-label add-ons | Flexible sharing, good scalability | Scalable with add-ons | Agencies, Teams | TV display mode, multiple sharing options | Subscription-based |
| Geckoboard | 90+ integrations, TV mode, admin controls | Quick deployment, clean design | Ideal for team KPIs | Marketing teams, Ops | Wallboard/TV focus | Subscription-based |
| Cyfe | All-in-one dashboards, unlimited data history, white-label | Very affordable, simple sharing | Budget-friendly SMB fit | Small agencies, SMBs | Unlimited data, API/custom widgets | Low-cost subscription |
| Domo | Data integration, drag-drop ETL, governance, AI features | Full platform, scalable enterprise solution | End-to-end marketing performance | Large enterprises, Enterprises | Embedded analytics, AI-driven insights | Quote-based |
| Zoho Analytics | Data modeling, AI, extensive marketing connectors | Competitive pricing, Zoho integration | SMB-focused, seamless Zoho ecosystem | SMBs, Businesses using Zoho | Portal sharing, AI insights | Subscription-based |
| HubSpot Marketing Hub | Prebuilt/custom dashboards, multi-touch attribution | Native marketing ops integration | Unified marketing reporting | Marketers using HubSpot | In-tool campaign & attribution reporting | Tiered, starting around $50/mo |
Choosing the Right Dashboard for a Clearer Marketing Picture
Navigating the expansive landscape of marketing dashboard tools can feel overwhelming, but making an informed choice is a critical step toward data-driven success. As we've explored, the "best" tool is not a one-size-fits-all solution; it is a strategic asset that must align perfectly with your team's unique operational needs, technical capabilities, and business objectives. The journey from raw data to actionable insight hinges on selecting a platform that transforms complexity into clarity.
A key takeaway from our deep dive is that the market offers a spectrum of solutions tailored to different scales and specializations. For instance, free yet powerful tools like Google Looker Studio offer an accessible entry point for small businesses and individual marketers who need to consolidate data from Google's ecosystem. On the other end, enterprise-grade platforms such as Tableau, Looker (Google Cloud), and Microsoft Power BI provide the deep analytical power, governance, and scalability required by large organizations with dedicated data teams.
How to Make Your Final Decision
To move from this list to a final decision, your team needs to conduct a focused internal audit. Don't get distracted by the longest feature list. Instead, prioritize the factors that will have the most significant impact on your daily workflow and long-term goals.
Here are the crucial questions to guide your selection process:
- Who are the end-users? Will your dashboards be used by C-suite executives who need high-level KPIs (like Geckoboard excels at), or by data analysts who need to drill down into complex datasets (a strength of Power BI or Looker)? The user's technical skill level is a paramount consideration.
- What are your primary data sources? Create a definitive list of every platform you need to connect, from social media channels and ad networks to your CRM and email marketing software. Tools like Databox and Cyfe shine with their vast libraries of pre-built integrations, simplifying this process immensely.
- What is your budget? Be realistic about both initial subscription costs and the potential need for developer or analyst resources for implementation and maintenance. While Zoho Analytics offers great value, a more complex tool might require a significant investment in specialized talent.
- How much customization do you need? Do you require the ability to build completely bespoke visualizations and perform complex data modeling, or are pre-built templates and widgets sufficient for your reporting needs? Klipfolio, with its dual Klips and PowerMetrics offerings, provides a great example of this flexibility.
- Does it solve a specialized need? For agencies and brands in the creator economy, generic BI tools often fall short. They lack the integrated workflows for campaign management, creator communication, and payment processing. This is where a purpose-built platform like REACH provides a definitive advantage by combining powerful reporting with end-to-end influencer marketing management.
Implementation: The Final and Most Important Step
Once you've chosen your tool, successful implementation is key. Start with a pilot project focused on a single, critical business question. This approach allows your team to learn the platform in a controlled environment and demonstrate its value quickly, building momentum for wider adoption. Ensure you provide adequate training and establish clear standards for how dashboards will be built, shared, and interpreted across the organization.
Ultimately, the right marketing dashboard tool does more than just display metrics; it tells a story about your performance, highlights opportunities, and empowers every member of your team to make smarter, faster decisions. By carefully evaluating your needs against the solutions we've covered, you can select a partner that illuminates your path to growth and provides a truly clear picture of your marketing impact.
For teams focused on the creator economy, a generic dashboard only shows part of the picture. REACH is an all-in-one influencer marketing platform that includes a powerful, integrated dashboard designed to track everything from campaign ROI and creator performance to audience demographics and payments. See how a specialized tool can streamline your entire workflow by visiting REACH today.
