

Share of Voice (SOV) is simply your brand’s slice of the market pie, showing how much of the conversation you actually own compared to your competitors. To figure it out, the formula is straightforward: (Your Brand Metric / Total Market Metric) x 100. This one calculation can shift your strategy from guesswork to a clear, data-backed plan that connects marketing efforts to real business growth.
Why Share of Voice Is a Critical Brand Metric

In a market overflowing with noise, just showing up isn’t good enough. You need to know how much space your brand truly occupies in the minds of your audience. Share of Voice gives you that clarity.
Far from being a vanity metric, SOV is a powerful indicator of your brand’s health and one of the most reliable predictors of future market share. The rule of thumb is simple: if your SOV is higher than your market share, you're on a growth trajectory. If it's lower, you're likely to lose ground to the competition.
Think of it like a conversation at a party. If everyone is buzzing about three new movies, the one mentioned most often has the highest share of voice. It becomes top-of-mind, memorable, and the one people are most likely to see. Your brand is no different.
Beyond Traditional Advertising
Back in the day, SOV was all about advertising spend. It was a simple, direct calculation: your ad budget versus the total ad spend in your category. For instance, if you invested $5 million in advertising in a market where the total spend was $100 million, you had a 5% SOV. This traditional view still has its place, especially in paid media, because a dominant ad presence almost always leads to better brand recall. You can dig into its roots in most foundational marketing analysis.
But the game has changed. Today's definition of SOV has expanded far beyond paid channels to cover the full spectrum of digital interactions. This gives you a much richer, more accurate picture of your brand's visibility.
This modern view includes:
- Organic Search Visibility: How often do you pop up in search results for your most important keywords compared to your rivals?
- Social Media Mentions: What’s the volume of chatter about your brand on platforms like Instagram, X, and TikTok versus the competition?
- PR and Media Coverage: How frequently is your brand featured in news articles, blogs, and other publications?
The Strategic Value of Tracking SOV
Keeping an eye on your Share of Voice isn't just a box-ticking exercise. It delivers real, actionable intelligence that should be at the heart of your marketing strategy. By consistently measuring where you stand, you can pinpoint competitor weaknesses, spot untapped opportunities, and justify your marketing spend with hard data.
A low SOV isn't a failure—it's a roadmap. It tells you exactly where you need to focus, whether that’s creating more compelling content, targeting underserved keywords, or dialing up your presence on a key social channel.
Let's say a competitor is crushing it in paid search, but you notice their organic social media is a ghost town. That’s your opening. By investing in building a vibrant community on social media, you can carve out a significant share of voice where your competitor is completely absent. This kind of strategic thinking allows you to compete smartly, even with a smaller budget, by picking your battles and focusing on the areas you can realistically win.
The Share of Voice Formula and What Metrics to Actually Track

To really get a handle on your share of voice, you need to start with a simple, flexible formula. The beauty of this calculation is that its core logic never changes, giving you a consistent way to measure your visibility against everyone else in your space.
Here's the fundamental formula:
(Your Brand Metric / Total Market Metric) x 100 = Your Share of Voice %
This simple equation works no matter what channel you're looking at, from organic search to social media. The real skill is in choosing the right "metric" to plug in—a number that truly reflects visibility and conversation for that specific channel. The formula stays the same, but your inputs will differ depending on where you're measuring.
For example, a common approach involves dividing your brand's mentions, clicks, or impressions by the total for all competitors in your market. Let's say a company tracking social media finds its brand was mentioned 20,000 times last month. If the total number of mentions for their entire category was 200,000, they’d have a 10% SOV. It's a clear, straightforward snapshot of their conversational footprint.
Picking the Right Metrics for Digital Channels
Long gone are the days of just tracking ad spend. A modern SOV analysis demands a multi-channel perspective, zeroing in on the digital places where your audience actually hangs out. Nailing down the right metric for each channel is absolutely critical if you want the final number to mean anything.
Here’s a quick rundown of the essential metrics you should be tracking:
- Organic Search (SEO): Your focus here is on organic keyword rankings and overall search visibility. The idea is to see how often your website shows up in search results for your industry’s most important keywords compared to your competitors.
- Paid Search (PPC): The most direct metric for PPC is Impression Share. Tools like Google Ads give you this data, telling you exactly what percentage of potential impressions your ads actually captured.
- Social Media: This is all about the volume of conversation. You’ll want to track direct brand mentions (@yourbrand), the use of your branded hashtags (#yourcampaign), and general engagement on topics relevant to your industry.
- Media and PR: For public relations efforts, a simple count of articles or media placements in relevant publications is a great way to measure your earned media footprint.
A huge mistake I see people make is only tracking SOV on a single channel. A competitor might be spending a fortune to dominate paid search, but if their social media presence is a ghost town, you’ve just found a massive strategic opportunity. A holistic view is the only way to see the full picture.
A great way to uncover these kinds of openings is by performing a comprehensive keyword gap analysis to see where your competitors are ranking that you aren't.
To help you get started, here's a table that breaks down the specific metrics to use for calculating Share of Voice across different marketing channels. It's a handy reference for putting this into practice.
Key Metrics for Calculating Share of Voice by Channel
| Channel | Metric to Track | Example Calculation |
|---|---|---|
| Organic Search (SEO) | Organic Clicks, Search Visibility Score | (Your Organic Clicks / Total Market Clicks) x 100 |
| Paid Search (PPC) | Impression Share | Your Ad Impressions / Total Eligible Impressions |
| Social Media | Brand Mentions, Hashtag Usage, Reach | (Your Brand Mentions / Total Mentions for All Competitors) x 100 |
| Public Relations (PR) | Number of Articles/Media Placements | (Your Media Placements / Total Industry Placements) x 100 |
| Content Marketing | Organic Traffic to Blog, Backlinks | (Your Blog Traffic / Total Market Blog Traffic) x 100 |
This table provides a clear starting point, but don't be afraid to adapt these metrics to fit the unique dynamics of your industry.
Putting the Formula to Work: A Real-World Example
Alright, let's make this tangible. Imagine you’re a software company trying to calculate your SOV in organic search for the term "project management tools."
Your first move is to define your market. This means identifying your top five competitors—the ones who consistently show up for that keyword. This step is critical; if your competitive set is off, your data won't be relevant. You can learn more about this in our guide on how to conduct a proper competitor analysis.
Next, you have to gather the data. Using an SEO tool, you discover the total monthly search volume for that keyword is 100,000. Your site gets about 15,000 of those monthly organic clicks, while your five main competitors pull in a combined 60,000.
So, the total market metric is the sum of all relevant traffic: 15,000 (yours) + 60,000 (competitors) = 75,000.
Now, you just plug those numbers into the formula:
(15,000 / 75,000) x 100 = 20%
Your organic search SOV for "project management tools" is 20%. That single number tells a powerful story. It gives you a concrete benchmark to improve upon and a clear way to measure whether your SEO efforts are actually paying off. You can apply this same logic to any channel, giving you a powerful toolkit for understanding your place in the market.
How to Calculate Your Share of Voice Manually
You don't need a pricey software suite to get a handle on your market position. While sophisticated tools are great, a manual approach to calculating your share of voice is surprisingly effective, especially when you’re zeroed in on a specific channel like organic search. It’s all about being resourceful and turning raw data into a real competitive advantage.
Let's walk through a practical scenario. Imagine you run a boutique coffee roastery called "Aroma Gold." You want to see how you stack up in organic search for the keyword "specialty coffee beans online" against your main local competitors.
This simple breakdown shows the process: pull your data, check out the competition, and then do the math.
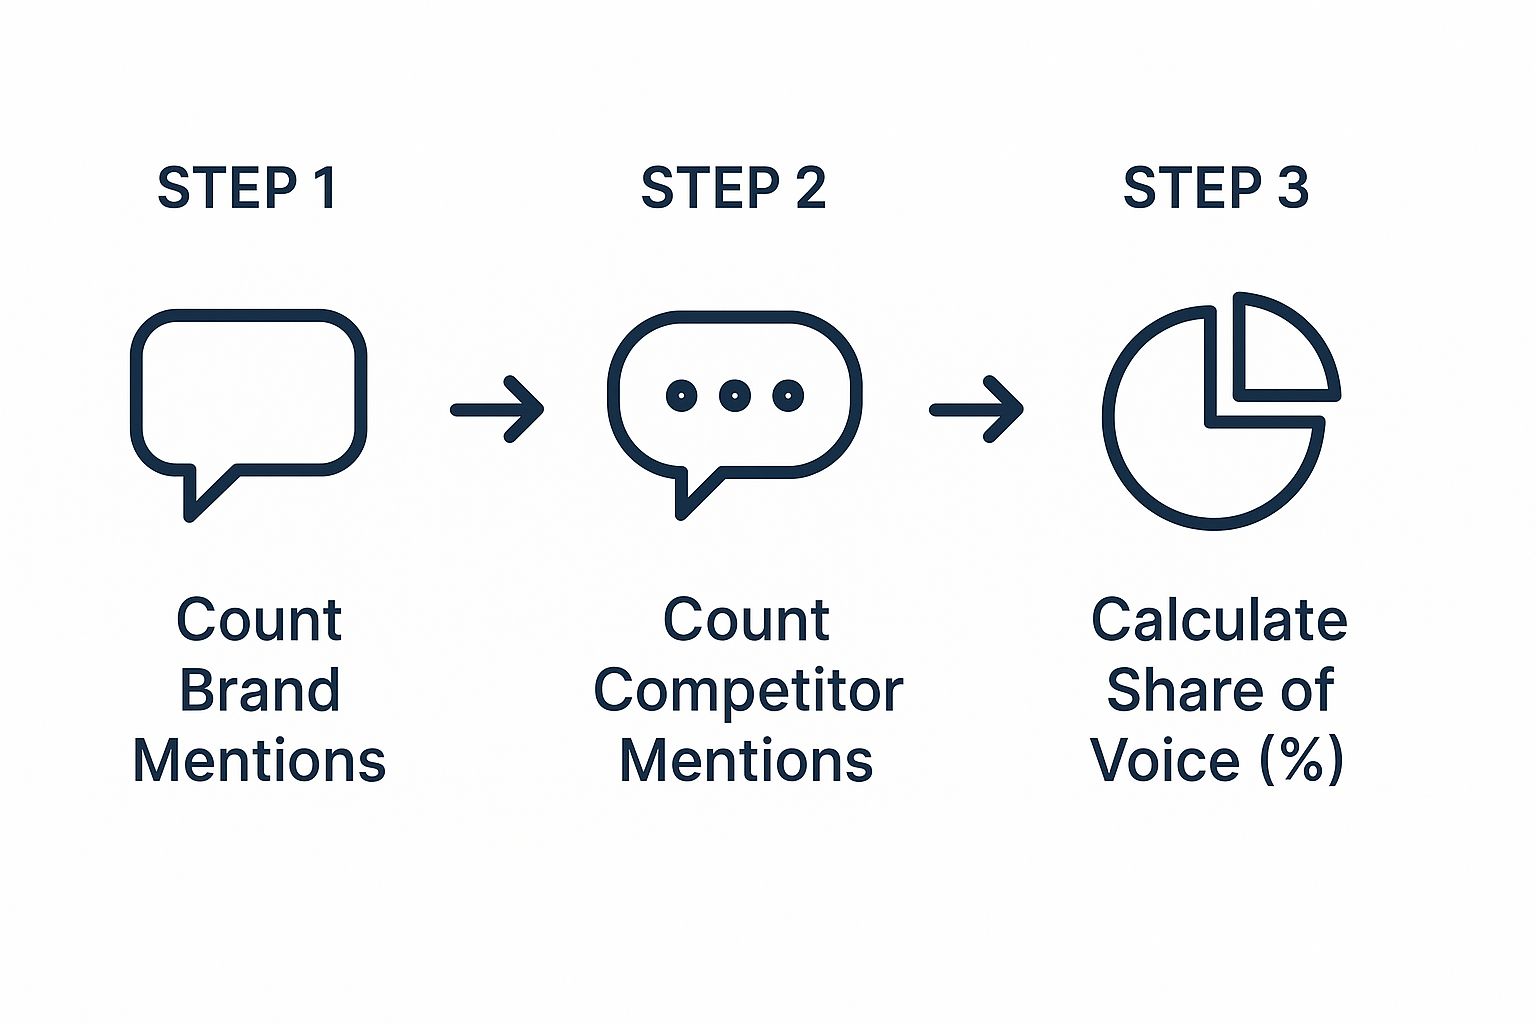
The flow is really that simple. Count your brand's metrics, count the total for the market you're analyzing, and then figure out your percentage. This method gives you a clear, actionable starting point.
Define Your Competitive Landscape
First things first, you need to identify who you're really competing with. Don't just list every coffee brand you can think of. For a specific keyword, your true competitors are the ones consistently showing up on the first page of Google.
Pop open an incognito window and search for "specialty coffee beans online." Jot down the top 5-7 brands you see in the organic results (you can ignore the ads and map packs for this exercise). For our example, let's say your list looks like this:
- Bean Bros.
- Roast Masters
- The Coffee Collective
- And your brand, Aroma Gold
These are the key players in this specific digital arena. Keeping your list focused is the secret to getting a meaningful result.
Gather the Necessary Data
Now it's time to do a little digging. For organic search, the easiest metric to work with is the estimated monthly organic traffic for your target keyword. A simple spreadsheet is your best friend here.
Set up a few columns: "Brand," "Estimated Monthly Clicks," and "Keyword."
To find this data, you can use free or freemium SEO tools that provide traffic estimates. For our "specialty coffee beans online" example, let's say you've gathered these numbers:
| Brand | Estimated Monthly Clicks |
|---|---|
| Bean Bros. | 800 |
| Roast Masters | 1,200 |
| The Coffee Collective | 1,500 |
| Aroma Gold (Your Brand) | 500 |
This data is the bedrock of your whole analysis.
Run the Calculation
With your data all lined up, you’re ready to plug it into the share of voice formula. It's just two quick steps.
1. Tally the Total Market Metric
Start by adding up the estimated monthly clicks for all the brands on your list, including your own. This number is your "total market" for the keyword.
800 (Bean Bros.) + 1,200 (Roast Masters) + 1,500 (The Coffee Collective) + 500 (Aroma Gold) = 4,000 total monthly clicks.
2. Calculate Your Share of Voice
Next, take your brand’s number and divide it by the total market figure. Multiply that result by 100 to turn it into a percentage.
(500 / 4,000) x 100 = 12.5%
And there you have it. Aroma Gold has a 12.5% share of voice for organic traffic on the keyword "specialty coffee beans online."
This number is more than just a vanity metric; it’s your benchmark. You now have a concrete starting point to measure against. If you kick off a new SEO campaign, you can run this calculation again in a few months to see if your hard work actually moved the needle.
This manual process gives you a powerful snapshot without needing any complex software. It puts the power to make data-backed decisions in your hands, whether you're a small business owner trying to grow or a marketer proving your value. Best of all, you can use this exact same process for social media mentions, hashtag usage, or any other channel where you can count the relevant data points.
Cracking the Code: SOV in Retail Media and Ecommerce
When you're selling on a platform like Amazon, Walmart, or Instacart, visibility isn't just a goal—it's everything. Calculating your share of voice here isn't a vanity metric; it’s about claiming your space on the digital shelf right where people are clicking "buy."
This is what makes SOV so potent in ecommerce. It's not about tracking brand mentions across the web. Instead, it's a direct measure of how much of the shoppable space you own. A 30% SOV on Amazon, for instance, means your ads are capturing 30% of all available impressions for a key search term. That kind of visibility almost always leads to more sales, as shoppers just naturally click on the products they see first. You can dive deeper into how top brands are winning with this approach on Pacvue's blog.
If your SOV is low, it’s a warning sign. You’re likely being drowned out by more aggressive competitors, and it's time to rethink your ad spend or strategy before you disappear completely.
The Metrics That Really Matter for Ecommerce SOV
Unlike general brand marketing, SOV on retail platforms is concrete and measurable. You’re not tracking conversations; you're tracking prime real estate.
Here’s what you need to be looking at:
- Sponsored Product Placements: This is the most direct measure of your ad spend at work. It tells you how often your paid ads show up in top search results and on product pages compared to everyone else.
- Organic Search Rankings: This is your slice of the "free" visibility pie. A high organic rank for your most important keywords means the platform's algorithm sees your product as a top contender, earning you views without paying for every click.
- Share of Digital Shelf: Think of this as the big picture. It combines both your sponsored and organic placements to give you a complete view of your presence across an entire category, just as a shopper would see it.
A Real-World Battle on the Digital Shelf
Let's make this real. Imagine two electronics brands, "VoltTech" and "Connecta," are going head-to-head for the "wireless earbuds" market on Amazon during the holiday rush.
VoltTech goes all-in on sponsored product ads, aiming to capture at least a 40% share of the top-of-search placements. Connecta, on the other hand, puts its energy into SEO, optimizing its product listings to lock down a top-three organic rank.
So, how do they figure out who's winning?
First, they have to define the battlefield. Both brands would identify the top 10 competing products that consistently show up for the "wireless earbuds" search.
Next, they collect the data. Using a retail media tool, they would track total ad impressions and daily organic search rankings over a week.
Finally, they run the numbers. VoltTech finds that out of 1,000,000 total sponsored impressions available, their ads got 400,000. That's a 40% sponsored SOV. Boom. Meanwhile, Connecta discovers their product consistently holds one of the top 5 organic spots, giving them a 20% organic SOV.
By tracking SOV for both paid and organic placements, both brands get a much clearer picture of what's working. VoltTech knows their ad dollars are turning into visibility, and Connecta can see their SEO efforts paying off. It's less about who sold more yesterday and more about who is positioned to dominate tomorrow.
This kind of data is what allows you to make smart moves quickly. If VoltTech’s sponsored SOV starts to slip even though their spend is high, they know they need to tweak their bids. If Connecta's organic rank drops from #3 to #8, it’s a signal to refresh their product title, keywords, or images. This is how you use share of voice to actively drive your strategy, not just report on past performance.
Turning Share of Voice Data into a Winning Strategy

Getting your share of voice number is just the first step. The real magic happens when you figure out what to do with that number. Turning that raw SOV data into a smart, actionable marketing strategy is how you truly get a leg up on the competition.
Think of the data as a story about where you stand in the market. A low score isn’t a failure—it's a map pointing to all the hidden opportunities. And a high score isn't a cue to sit back and relax; it's a sign that you have a position you need to defend.
Your SOV report should be the blueprint for your next marketing moves. It helps you get out of a reactive mode and into a proactive one, letting you put your budget and effort where they’ll actually make a difference.
Interpreting Your SOV Score: What to Do Next
Your SOV percentage really dictates your entire game plan. A brand sitting at 5% SOV needs a radically different approach than one dominating with 40%. The first step toward real growth is knowing how to react to where you are right now.
A low SOV usually tells you one of two things: you're either the new kid on the block or you're being outspent and outmaneuvered. This calls for a sharp, disruptive strategy. Forget trying to compete everywhere at once. Your job is to find one weak spot and hit it hard.
On the flip side, a high SOV means you’re a market leader. Your challenge isn't about getting seen anymore; it's about staying seen. You can bet your competitors are actively trying to steal your spotlight, so your strategy has to be all about reinforcement and staying ahead of the curve.
Your SOV score is a compass, not just a report card. Use it to find your direction. Whether you need to attack a competitor's weak flank or fortify your own position, the data shows you the way.
So, how do you turn your percentage into a concrete plan? This table breaks down some clear, actionable strategies you can use based on where you land.
Interpreting Your SOV Score: What to Do Next
Knowing your SOV score is one thing; knowing what to do with it is another. Your next moves depend entirely on whether you're a challenger trying to break in or a leader trying to stay on top. Here’s a quick guide to help you translate that number into a smart strategy.
| Your SOV Level | What It Means | Recommended Strategic Actions |
|---|---|---|
| Low (0-10%) | You're a challenger brand or being significantly outspent. Visibility is low, and you need to carve out a space for yourself. | Attack a Niche: Pour all your energy into a single, underserved keyword or social channel where competitors are weak. Own that small pond before trying to take on the ocean. |
| Moderate (11-30%) | You're an established player but not a market leader. You’ve got some visibility, but there's plenty of room to grow and exert more influence. | Expand Your Presence: Identify the next-best channel for your brand and start building a solid presence there. It's time to ramp up your content volume and quality to claim more territory. |
| High (31%+) | You're a market leader with dominant visibility. The main goal now is to defend your turf and maintain your authority in the space. | Defend and Innovate: Keep a close eye on your competitors. Launch fresh campaigns and create thought leadership content that constantly reinforces why you're number one. |
Once you've got a strategy based on your SOV level, you can start putting it into practice.
From Data to Actionable Tactics
With a clear strategy in mind, it's time to get your hands dirty with specific tactics. These are the day-to-day moves that will actually shift that SOV number over time.
For a brand with a low SOV, it's all about being scrappy and efficient. Don't spread your budget thin. If a competitor is dominating paid search, check out their organic social media. Is it an afterthought? That’s your opening. Pour your resources into building an amazing community there.
Here are a few practical tactics you can put into play:
- Target Competitor Gaps: Use your favorite SEO tool to find valuable keywords your competitors are ranking for but have weak or outdated content. Your mission is to create something 10x better and steal that traffic.
- Fill the Content Void: Listen to the conversations happening in your industry. What questions are people constantly asking that nobody is answering well? Be the first to create that ultimate guide, video, or tool.
- Double Down on Your Strongest Channel: If your data shows you have a decent 15% SOV on TikTok but only 2% on Instagram, forget Instagram for a bit. Focus all your creative energy on becoming a TikTok powerhouse. Own that space before you expand.
- Use Influencer Collaborations: Teaming up with the right creators can give you an instant SOV boost in very specific niches. A well-chosen influencer can introduce your brand to their dedicated audience, letting you "borrow" their share of voice. Of course, knowing how to measure influencer marketing ROI is crucial to making this tactic profitable and scalable.
Let's walk through a quick example. Imagine a new meal-kit delivery service with a tiny 5% SOV. They notice the market leader spends a fortune on Google Ads, but their blog content is bland and generic.
The challenger's strategy? They go all-in on content around "easy 15-minute vegan meals"—a niche the big guy has completely ignored. By creating amazing recipes, short-form videos, and social content around this single topic, they can start to completely dominate the conversation in that one area.
This focused approach helps them build a fiercely loyal following and grow their overall SOV without needing a massive ad budget. That's how you turn a simple number into a winning play.
Common Questions About Share of Voice
https://www.youtube.com/embed/HkvsCRyIDrA
As you start working Share of Voice into your marketing strategy, you're bound to run into a few practical questions. That's perfectly normal. Getting the details right is what turns a vague metric into a real, strategic advantage.
Let's cut through the confusion and tackle some of the most common hurdles people face. This is your go-to guide for the "what ifs" and "how to's" of SOV analysis.
How Do I Choose the Right Competitors to Track?
This is probably the most important decision you'll make in the whole process because it sets the stage for everything that follows. A huge mistake I see people make is just listing their main business rivals and calling it a day. For SOV, you need to be way more surgical.
Your competitive set can—and often should—change depending on where you're measuring. Think about it: the brands you're fighting for space on a Google search results page might be totally different from who you're up against on Instagram.
- For SEO: Your real competitors are the websites that consistently show up for your top 10 target keywords. It doesn’t matter if they sell the exact same product; if they own the SERP, they're your competition.
- On Social Media: On a platform like TikTok or Instagram, your competitors are the other accounts grabbing your audience's attention around key topics or hashtags.
- For Brand Health: It’s still smart to keep a core list of 3-5 direct business competitors for those high-level, big-picture comparisons.
The trick is to define your "market" for each specific channel you're analyzing. Don't just copy and paste your competitor list. Let the data from each platform show you who you're really up against.
This focused approach is what makes your insights sharp and genuinely useful.
How Often Should I Calculate Share of Voice?
There's no magic number here. The right cadence really depends on how fast your industry moves and what you're trying to achieve with your marketing.
For most brands, monthly tracking is the sweet spot. It’s frequent enough to catch important trends and see how your campaigns are doing, but not so frequent that you get lost in the noise of daily ups and downs.
That said, you might need to adjust based on the situation:
- During a Big Campaign Launch: You’ll want faster feedback. I'd recommend switching to weekly or bi-weekly tracking to monitor the immediate impact and make quick adjustments.
- In a Fast-Paced Industry: If you're in a field like consumer electronics or fast fashion, things change in a blink. More frequent checks are essential just to keep up.
- For Annual Strategic Planning: A big-picture deep dive every quarter or twice a year gives you the high-level view you need for smarter long-term budgeting and resource planning.
What’s more important than frequency is consistency. Pick a schedule and stick with it. That’s how you build a reliable benchmark to measure against over time.
What Is a Good Share of Voice Score?
This is the classic "it depends" question. What's considered "good" is completely relative. A 10% SOV might be an incredible win for a new startup trying to break into a crowded space, while a 30% SOV could be a major red flag for an established market leader.
Instead of fixating on a universal number, focus on how your SOV relates to your actual market share. There’s a well-known marketing principle that says your share of voice should be a bit higher than your market share if you want to grow. If it's lower, you're at risk of losing ground.
Ultimately, your goal should be simple: grow your SOV every single quarter. Using some of the best influencer marketing tools can give you a serious leg up here, especially when you're trying to make a splash on new channels.
Ready to amplify your brand’s voice and connect with creators who can move the needle? REACH provides the tools you need to discover the right influencers, manage campaigns efficiently, and prove your ROI with clear analytics. Stop guessing and start growing. See how REACH can transform your influencer marketing.
