
So, what exactly is social media measurement?
At its core, social media measurement is the practice of tracking data to figure out if your social media efforts are actually helping your business. It means looking past surface-level numbers like likes and follows to connect what you do on social media to real-world results like brand awareness, leads, and sales. A solid measurement strategy is crucial for justifying budgets, optimizing campaigns, and proving the tangible value of your work.
Table of Contents
- Why Social Media Measurement Is Your Brand’s Navigation System
- How to Build a Social Media Measurement Framework
- Tying Social Metrics Back to Real Business Goals
- Choosing the Right Social Media Attribution Model
- Creating Social Media Reports That Tell a Story
- Common Social Media Measurement Pitfalls to Avoid
- Frequently Asked Questions About Social Media Measurement
Why Social Media Measurement Is Your Brand’s Navigation System
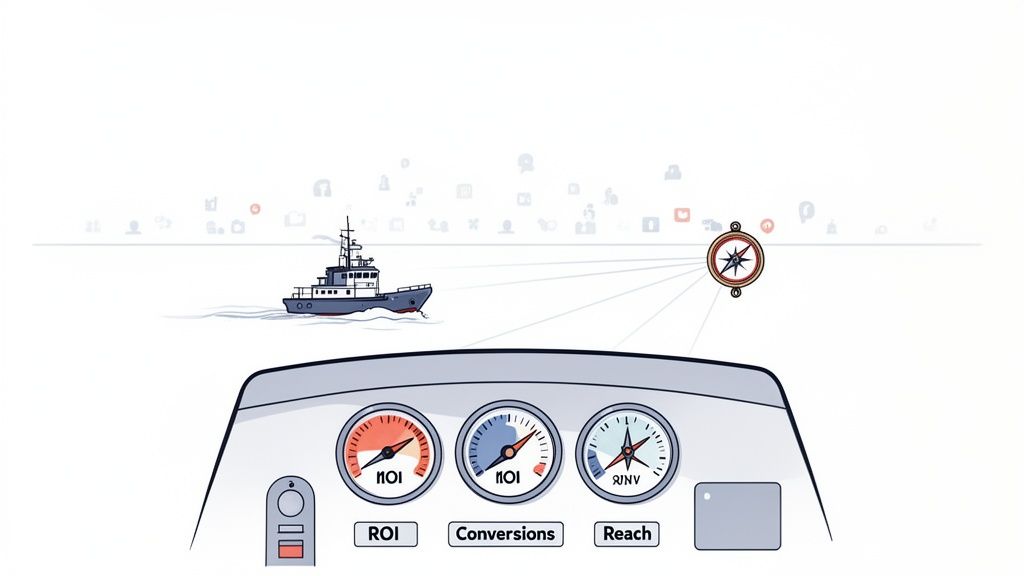
Imagine trying to sail a ship across the ocean without a compass or a map. You’d be moving, sure, but would you have any clue if you were heading toward your destination or just going in circles? That’s what running social media without measurement feels like. You’re sailing blind, burning time and money without knowing if you're making any real impact.
Think of social media measurement as your brand's navigation system. It's not about vanity metrics; it’s about connecting every single post, campaign, and interaction to a meaningful business result. In a world crowded with billions of social media users, this isn't just a "nice-to-have"—it's absolutely essential for survival and growth.
The Scale of the Social Media Ocean
The sheer number of people on social platforms is what makes measurement so critical. By October 2025, the world hit an incredible milestone: 5.66 billion active social media user identities. That's 68.7% of the entire global population, a clear "supermajority" where users now outnumber non-users two to one.
And this audience isn't just massive; it's still growing at a rate of 4.8% year-over-year, as highlighted in DataReportal's big annual digital report.
With such a vast and active audience, simply being present isn't enough. You need a system to understand what resonates, what drives action, and what delivers a return on your investment. Without measurement, you're just adding to the noise.
This is where dedicated tools become your best friend. To truly understand performance, you have to dig deeper. Seeing what a tool like Linktree's analytics dashboard can show you about visitor engagement is a great example of moving beyond simple platform metrics. The right tools turn chaotic data into a clear, strategic direction.
Turning Data Into Actionable Insights with REACH Influencers
For brands and agencies, the biggest challenge is often translating a mountain of social data—especially from complex influencer campaigns—into a clear picture of success. This is exactly why platforms like REACH Influencers are so important. They act as the central nervous system for your campaigns, giving you the tools you need to:
- Demonstrate Tangible ROI: Connect what your influencers are doing directly to website clicks, sign-ups, and sales, proving the financial value of your efforts.
- Guide Your Strategy: Use real-time data to see which influencers, content types, and messages are hitting the mark, so you can make smart adjustments on the fly. You might be interested in our guide on how social media impressions contribute to this visibility.
- Convert Complexity into Clarity: Pull all your metrics from different campaigns and influencers into a single, easy-to-read dashboard, which saves you from guesswork and endless spreadsheets.
When you get measurement right, your social media strategy flips from being reactive to proactive. Instead of guessing what your audience wants, you know. Instead of just hoping for results, you can build a predictable engine for growth.
How to Build a Social Media Measurement Framework
Trying to measure social media without a plan is like navigating without a map. You might be moving, but you have no idea if you're heading in the right direction. You end up with a pile of data—likes, shares, comments—that doesn’t really tell you anything about what’s working for your business.
A solid measurement framework fixes that. It’s a simple, logical system that connects your social media activity directly to real business outcomes. The best way I’ve found to do this is by following a clear path: Goals → Objectives → Metrics → Targets.
Think of it like building a house. You wouldn't just show up with a hammer and some wood and hope for the best. You need a blueprint.
Start with Your Goal: The Blueprint
Your Goal is the big-picture reason you’re on social media in the first place. It’s the "why." This isn't about hitting a specific number; it's a broad, directional statement about what you want to accomplish for the business.
For example, a direct-to-consumer (DTC) brand’s main goal might be to increase brand loyalty. A B2B software company, on the other hand, might be focused on becoming a recognized thought leader in its niche. These high-level goals are the foundation for everything else.
Define Your Objectives: The Rooms
Once you have the blueprint, you can start planning the individual rooms. Objectives are the specific, actionable steps you'll take to reach your goal. They break that big ambition down into smaller, more manageable pieces. If the goal is the house, the objectives are the kitchen, the living room, and the master bedroom.
Let’s see how this plays out:
- For the DTC Brand (Goal: Increase brand loyalty): A clear objective would be to improve customer sentiment on social media. That’s a specific "room" that contributes to the overall structure of loyalty.
- For the B2B Service (Goal: Become a thought leader): A smart objective might be to increase audience engagement with their educational content. This helps build the authority you need to be seen as an expert.
Objectives are where your strategy starts to get real. They bridge the gap between your lofty business goals and the day-to-day data you'll be tracking.
A well-defined objective ensures every metric you watch has a purpose. It stops you from tracking vanity metrics and forces you to focus on data that's directly tied to a business outcome.
Select Your Metrics: The Building Materials
With the rooms designed, it's time to pick your building materials. Metrics are the specific, countable data points you’ll track to see if you're meeting your objectives. These are the bricks, lumber, and concrete of your measurement framework.
It’s absolutely critical to pick metrics that actually reflect your objective. Choosing the wrong ones is like trying to build a brick wall with wood—it just doesn't work.
- To measure improved customer sentiment, you’d track metrics like positive mentions, sentiment analysis scores, and the ratio of positive to negative comments.
- To measure increased audience engagement, you’d focus on metrics like shares per post, comment volume, and the average watch time on your videos.
This is the step where measurement becomes tangible. You’re moving away from abstract ideas and into hard numbers that tell a story.
Set Your Targets: The Dimensions
Finally, every room in your blueprint needs dimensions. Targets are the specific, time-bound numbers you aim to hit for each metric. They answer the simple question: "What does success actually look like?"
Targets make your goals real and hold you accountable. Without them, you’re just hoping for the best.
- For the DTC brand: A target could be to achieve a 15% increase in positive mentions over the next quarter.
- For the B2B company: A target might be to boost the average shares per post to 50 within six months.
By following this Goals → Objectives → Metrics → Targets framework, you create a repeatable system that’s both strategic and practical. It turns measurement from a confusing chore into a clear roadmap for success.
Tying Social Metrics Back to Real Business Goals
A solid measurement framework is a great start, but its true power is unlocked when you connect those numbers to what actually matters: your bottom line. This is where you draw a straight line from a "like" on an influencer's post to a sale in your store. The clearest way to do this is by mapping your social media metrics to the classic marketing funnel.
Think of the customer journey as a path with a few key stops: Awareness, Engagement, Consideration, Conversion, and Retention. Each stage has a different business goal, and your social metrics act as signposts telling you if people are moving in the right direction. Without this map, you're just counting activity without knowing if it's leading to any real business results.
This hierarchy shows you exactly how to structure your thinking, starting with big-picture business goals and drilling down to the specific metrics that prove you're hitting them.
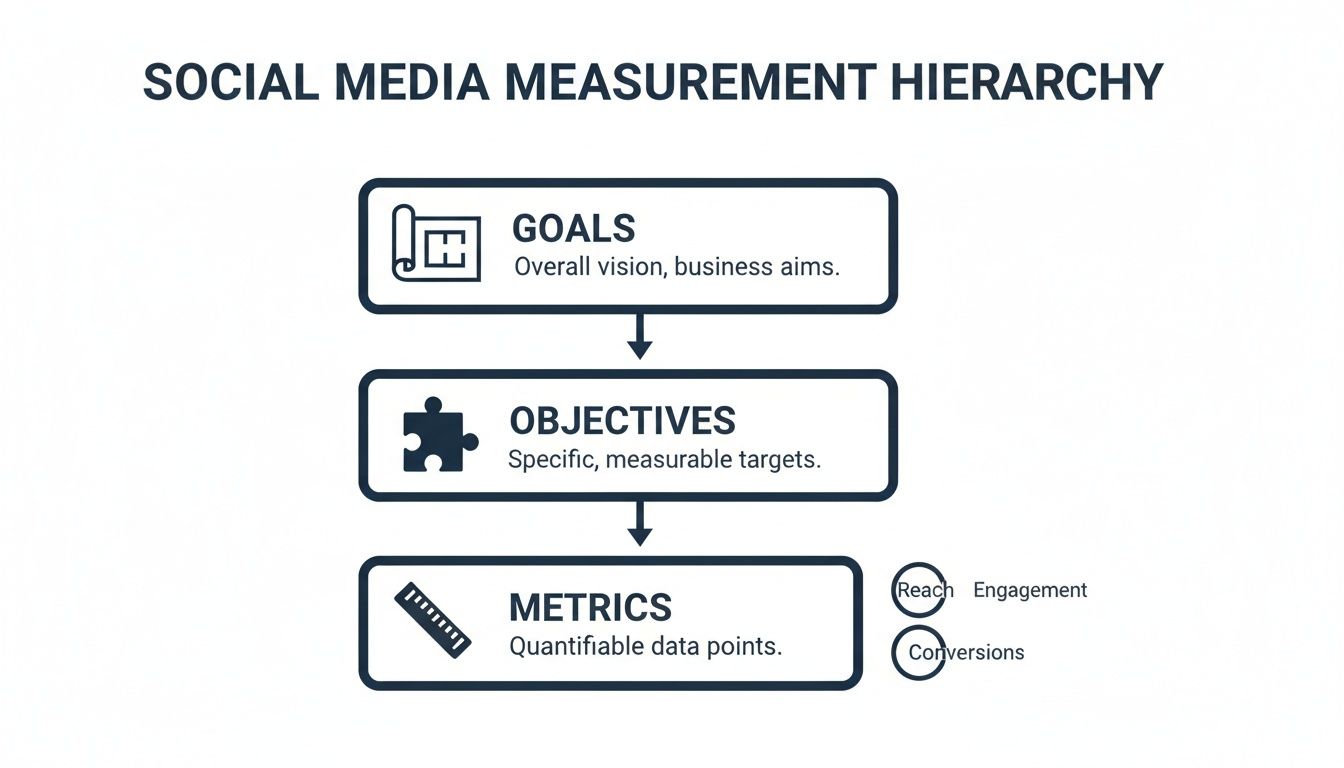
Following this structure keeps you from getting distracted by vanity metrics and ensures every number you track serves a real purpose.
To make this crystal clear, let's break down which metrics matter at each stage of the funnel.
Mapping Social Metrics to the Marketing Funnel
This table gives you a simple playbook for what to track and when, linking your social media efforts directly to core business objectives.
| Funnel Stage | Business Objective | Key Social Media Metrics |
|---|---|---|
| Awareness | Get on people's radar and increase market share. | Reach and Impressions. |
| Engagement | Build a community and foster a positive connection. | Likes, Comments, Shares, and Engagement Rate. |
| Consideration | Drive purchase intent and move people to action. | Click-Through Rate (CTR) and Website Traffic. |
| Conversion | Generate sales and prove ROI. | Conversion Rate, Cost Per Conversion, and ROAS. |
| Retention | Foster loyalty and create brand advocates. | Repeat Purchase Rate and Positive Mentions. |
Now, let's dig into what each of these stages looks like in practice.
Stage 1: Awareness – Getting Seen and Heard
At the very top of the funnel, your only job is to get noticed. The business goal is to increase market share or simply build brand recognition in a noisy market. You want to be the first name that pops into someone's head when they think about your industry.
For this, you need to track metrics that show how many eyeballs you're reaching.
- Reach: The number of unique people who saw your content. This tells you how wide you're casting your net.
- Impressions: The total number of times your content was seen. This can include multiple views by the same person, showing how much screen time you're getting.
When an influencer posts about your brand, these top-of-funnel metrics tell you exactly how many potential new customers you've just been introduced to.
Stage 2: Engagement – Building a Community
Once people know you exist, the next challenge is to get them to interact. Here, your business objective is to build a community and create a genuine connection with your audience. This is about turning passive viewers into active participants.
The metrics that count here are all about action:
- Likes, Comments, and Shares: The classic signs that your content hit a nerve and prompted someone to do something.
- Engagement Rate: The magic number (total engagements divided by followers or reach) that tells you how compelling your content is, no matter how big your audience is.
A high engagement rate on an influencer's post is a fantastic signal. It means their audience truly trusts their opinion and is genuinely curious about what you have to offer.
Stage 3: Consideration – Driving Purchase Intent
During the consideration stage, your audience is actively weighing their options. Your goal is to drive purchase intent by giving them the information and social proof they need to pick you over the competition. They're shifting from "that's interesting" to "should I buy this?"
Here, you need to track metrics that show people are digging deeper:
- Click-Through Rate (CTR): The percentage of people who actually clicked a link in a post. A high CTR is a strong sign that someone wants to learn more.
- Website Traffic from Social: Using tools like Google Analytics, you can see how many visitors are flowing from social media right to your digital doorstep.
A well-planned influencer campaign can be a game-changer here. When a trusted creator shares a unique discount code or a direct link to a product, they give their followers a powerful nudge to move from just looking to actively shopping.
Stage 4: Conversion – Driving Sales
This is it—the moment of truth. The objective at the conversion stage is crystal clear: drive sales and revenue. Every effort you've made leads to this point, where a follower officially becomes a customer.
The most critical metrics here are tied directly to your wallet:
- Conversion Rate: The percentage of people who clicked a link and then completed a specific action, like making a purchase.
- Cost Per Conversion: How much you had to spend to get one person to convert.
- Return on Ad Spend (ROAS): The total revenue you made for every dollar you spent on ads.
Platforms like REACH make this incredibly straightforward by offering a central dashboard with real-time click and conversion tracking. This lets you see exactly how an influencer’s post turns into website visits and sales, proving your ROI without any guesswork. You can tie every dollar of revenue back to a specific creator, making your social media measurement both precise and powerful.
Stage 5: Retention – Fostering Loyalty
The journey isn't over after the first purchase. The final stage, retention, is all about fostering customer loyalty and turning those one-time buyers into repeat customers and, eventually, brand advocates.
Key metrics to watch for retention include:
- Customer Lifetime Value (CLV): The total amount of money a customer is projected to spend with you over their entire relationship.
- Repeat Purchase Rate: The percentage of customers who come back for more.
- Positive Mentions and Reviews: Keeping an eye on user-generated content and reviews from happy customers provides powerful social proof for new buyers.
By mapping your metrics to these distinct funnel stages, you turn social media measurement from a chore into a strategic weapon. It gives you a clear line of sight from a single post all the way to your company’s bottom line.
Choosing the Right Social Media Attribution Model
Once you're tracking metrics across your funnel, you hit the million-dollar question: who gets the credit? A customer's journey is rarely a straight line. They might see an influencer’s Reel, click a paid ad a week later, and finally buy after seeing a retargeting post on their feed. True social media measurement means figuring out which of those moments mattered most. This is where attribution comes in.
Think of it like a soccer team scoring a goal. Who’s the hero? The defender who started the play? The midfielder who made the perfect pass? Or the striker who kicked the ball into the net? Different attribution models give credit in different ways, and the right one for you comes down to what you’re trying to achieve with your campaign.
Getting this wrong can be costly. You might slash the budget for a top-of-funnel influencer whose content kicked off the entire customer journey, all because they didn't get that final click. To get a handle on this, exploring various marketing attribution software tools can give you the clarity you need for your overall measurement strategy.
Understanding First-Touch Attribution
First-Touch attribution is as simple as it sounds: it gives 100% of the credit for a conversion to the very first interaction someone had with your brand. In our soccer analogy, this model gives all the glory to the defender who first booted the ball upfield.
This model shines when your primary goal is building brand awareness. If you want to know which channels or campaigns are the best at introducing your brand to new people, First-Touch is a great way to measure that.
- When to Use It: Perfect for top-of-funnel campaigns where your main objective is to generate new leads and build that initial spark of awareness.
- Pros: It’s easy to set up and clearly points to which channels are starting the conversation.
- Cons: The biggest drawback is that it completely ignores every other touchpoint. It undervalues the channels and content that nurture leads and guide them toward a purchase.
Demystifying Last-Touch Attribution
On the flip side, you have Last-Touch attribution. This model gives 100% of the credit to the final touchpoint a customer engaged with right before they converted. In our soccer game, this is like saying only the striker who scored the goal did any of the work.
This is one of the most common models out there, partly because it's often the default setting in many analytics platforms. It’s valuable for quickly seeing which channels are most effective at sealing the deal.
- When to Use It: It’s a great fit for campaigns with short sales cycles or when you really want to pinpoint your strongest bottom-of-funnel channels.
- Pros: Super simple to measure and gives you a clear look at what’s driving the final conversion.
- Cons: It gives zero credit to all the hard work that went into building awareness and consideration to get the customer to that point in the first place.
Choosing between First-Touch and Last-Touch is a strategic decision. First-Touch rewards the opener, while Last-Touch rewards the closer. Neither tells the whole story, but both offer specific insights depending on what you want to measure.
The Power of Multi-Touch Attribution
The reality is, a customer journey is rarely a single step. Multi-Touch attribution gets this. It understands that, just like in soccer, converting a customer is a team effort. Instead of giving all the credit to one player, this model distributes it across multiple touchpoints for a much more balanced and realistic view of what’s working.
There are a few popular ways to slice this:
- Linear: This model is the diplomat—it gives equal credit to every single touchpoint in the journey. It's fair, but it doesn't distinguish between a casual glance and a game-changing interaction.
- Time-Decay: This model gives more weight to the interactions that happened closer to the sale. The first touchpoint gets some credit, but the last one gets the most.
- U-Shaped: This one focuses on the big moments: the beginning and the end. It gives the most credit to the first and last touchpoints (typically 40% each) and splits the remaining 20% among all the interactions in the middle.
Multi-Touch models paint a far more complete picture, but they have one non-negotiable requirement: clean, accurate data. This is where a platform like REACH Influencers becomes so critical. With real-time click tracking and conversion monitoring, REACH gives you the granular, user-level data needed to make these advanced models work. You can finally see which influencers are driving initial discovery and which ones are closing sales, giving you a true understanding of your entire funnel. To learn more, check out our guide on cross-channel marketing attribution for more advanced strategies.
Creating Social Media Reports That Tell a Story
Let's be honest: data on its own is just noise. The real magic happens when you turn those raw numbers into a story—one that’s compelling enough to make people take action. A great social media report doesn't just present data; it builds a narrative that’s clear, relevant, and persuasive.
Think about who you're talking to. A spreadsheet packed with metrics might get an analyst excited, but it's going to make your CEO's eyes glaze over. The trick is to tailor your report to your audience. A jumble of data points is useless, but a clear story connecting your social media activity to actual business outcomes? That’s priceless.
Your job is to be a translator. You’re turning complex data into a simple, powerful story about what’s working, what isn't, and what the company should do next.
Tailoring Reports for Different Audiences
Not everyone in the company needs to see every single metric. Customizing your reports ensures that each stakeholder gets exactly the information they need to make decisions, without getting bogged down in the details.
- For the C-Suite (Executives): They care about the bottom line, period. Keep it high-level. Focus on ROI, customer acquisition cost (CAC), and how social is impacting market share. Use clean charts and graphs to show progress against the big business goals at a glance.
- For the Marketing Team (Your Peers): This is where you can get into the weeds. Your team needs granular details—campaign-specific metrics, A/B test results, and performance breakdowns by channel or content type. This is where you dig into the "why" behind the numbers to fine-tune your strategy.
- For the Sales Team: They want to know how your work is making their job easier. Show them the leads you're generating. Highlight conversion rates from social traffic and share any juicy insights from social listening that could give them an edge in a sales call.
The best reports don't just state facts; they offer interpretation and actionable recommendations. Always answer the "so what?" question. Instead of saying, "Engagement was up 15%," try, "Our new video series drove a 15% lift in engagement, which tells us we should invest more in video production next quarter."
Establishing a Smart Reporting Cadence
Consistency is everything when it comes to measurement. A regular reporting schedule helps you spot trends, catch problems early, and keep your strategy nimble.
- Weekly Reports: Perfect for quick internal team huddles. Focus on short-term campaign metrics and any immediate tactical tweaks needed.
- Monthly Reports: This is for marketing leadership. It should track progress toward quarterly goals and highlight the big wins and key lessons learned.
- Quarterly Reports: This is the big picture for the C-suite and other department heads. Zoom out and show the overall impact on business objectives and ROI.
Things move fast online. By 2026, 93.8% of internet users are expected to log into social media monthly, spending over 2.5 hours a day across an average of 6.75 platforms. With 92.6% of adults already active, you can see why consistent reporting is non-negotiable to keep up. If you want to dive deeper, you can explore more about these trends in social media growth on seosherpa.com.
Automating Reports with REACH Influencers
Let's face it, manually pulling all this data together is a huge time sink and an open invitation for errors. This is where a great platform can be a complete game-changer, especially for agencies and brands juggling multiple accounts.
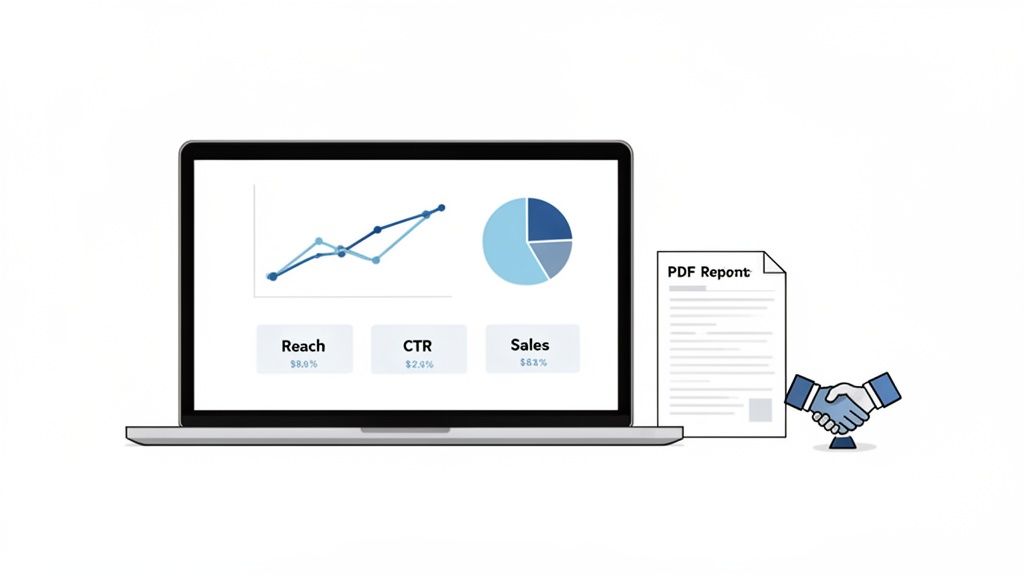
For instance, a tool like REACH Influencers automates the entire reporting process. Agencies can generate live, white-labeled reports that pull data in real-time. Imagine showing your clients a professional, data-driven presentation that clearly proves campaign ROI without you having to spend hours stuck in spreadsheets. That's how you prove your value and justify your work.
Automating your reporting is a core part of building a measurement system that's both efficient and scalable. A great first step is to explore building a powerful social media analytics dashboard to keep all your key metrics in one place.
Common Social Media Measurement Pitfalls to Avoid
Social media measurement is as much about sidestepping common traps as it is about tracking the right numbers. So many brands stumble into the same mistakes, ending up with data that's either misleading or completely useless for making smart decisions. If you know what to watch out for, you can build a process that gives you a truly accurate picture of your performance.
One of the biggest blunders is getting obsessed with vanity metrics. We've all seen them—follower counts and post likes that look great in a report but have zero connection to what actually matters to the business. Sure, a spike in followers feels good, but if those new people never click a link or buy anything, then what have you really gained?
Another classic mistake is inconsistent tracking. Imagine you calculate your engagement rate based on reach one month, then switch to using follower count the next. Your data is now apples and oranges. This chaotic approach makes it impossible to compare performance over time, so you can't spot real trends or figure out if your campaigns are actually working.
Ignoring Qualitative Data
Numbers only tell you half the story. A massive pitfall is overlooking the goldmine of qualitative data hiding in your comments and DMs. This is where you find out what people really think and feel about your brand—the all-important audience sentiment.
A post might have incredible engagement numbers, but if the comments are a dumpster fire of negativity, that’s a huge red flag your quantitative data will completely miss. Tracking sentiment adds the "why" behind the "what," giving you a much deeper read on brand health and customer happiness.
What Not to Do: Just counting the number of comments and assuming all engagement is good engagement.
What to Do Instead: Use social listening to analyze the actual tone of those comments. Are they positive, negative, or just neutral?
Disconnected Tools and Siloed Data
When your analytics are scattered across a dozen different platforms, you've created data silos. Your social stats are over here, your influencer data is over there, and your website traffic is in yet another system. This fragmentation makes it nearly impossible to see the full customer journey or figure out where your conversions are actually coming from.
This is where an integrated platform like REACH Influencers comes in. It pulls everything together into a single source of truth, connecting the dots between an influencer's post, a click to your website, and the final sale. It removes the guesswork and ensures every social media action is tied back to a real business goal, helping you dodge these common—and costly—mistakes.
Frequently Asked Questions About Social Media Measurement
Even with a solid plan in place, a few common questions always seem to pop up around social media measurement. Let's tackle some of the most frequent ones to help you clear up any confusion and feel confident in your strategy.
How Often Should I Be Reporting on My Social Media Metrics?
There’s no magic number here—it really depends on who you're reporting to and what they need to know. The best way to think about it is in tiers.
For the folks in the trenches (like your campaign managers), a live dashboard is a must. It gives them the real-time data needed for daily or weekly check-ins so they can make smart, quick adjustments.
When you're meeting with your internal team, a simple weekly report usually does the trick. It’s perfect for keeping everyone aligned on progress toward short-term goals. But for leadership and the C-suite, a monthly or quarterly report is the way to go. They want the big picture, so focus on high-level KPIs like Return on Investment (ROI) and customer acquisition cost (CAC) that tie your social efforts directly back to the bottom line.
What Are the Most Important Metrics for an Influencer Campaign?
With influencer campaigns, you have to look past the vanity metrics. The numbers that truly matter are the ones that measure real business impact and the quality of the audience connection.
- Engagement Rate: This is your best indicator of how an influencer's content is actually landing with their audience. High engagement suggests a genuine, active community.
- Click-Through Rate (CTR): This tells you how many people were intrigued enough to take the next step and click your link. It’s the first sign of someone moving from a passive viewer to an active prospect.
- Conversion Rate: This is the ultimate proof of performance. It answers the most important question: how many of those clicks actually turned into sales, sign-ups, or leads?
- Return on Investment (ROI): Did the campaign actually make money? This metric cuts through the noise and tells you if your investment was profitable.
Tools like REACH Influencers are designed specifically to track these bottom-of-the-funnel metrics. They help you move beyond just counting likes and followers to prove the real, tangible value of your influencer partnerships.
How Can I Measure Social Media ROI If I Don't Sell Products Directly?
Measuring ROI isn't always a straight line from a click to a purchase, and that's okay. You can absolutely prove your value by assigning a monetary value to actions that aren't direct sales.
Here's an example: Figure out the average lifetime value of a customer. From there, you can work backward to determine how many newsletter sign-ups or leads it typically takes to get one paying customer. Suddenly, every one of those sign-ups has a real dollar value attached to it.
Another way to look at it is through cost savings. Think about how much earned media you generated from user-generated content. How much would you have paid for that same exposure through traditional ads? The key is to draw a clear line from every social media action to a tangible business outcome, even if it's not an immediate sale. This approach ensures your social media measurement captures the full story of your impact.
Ready to stop guessing and start building a predictable growth engine with your social media? REACH Influencers gives you the tools to track the metrics that really matter, from influencer engagement all the way to sales conversions. Discover how REACH can prove your ROI today.
